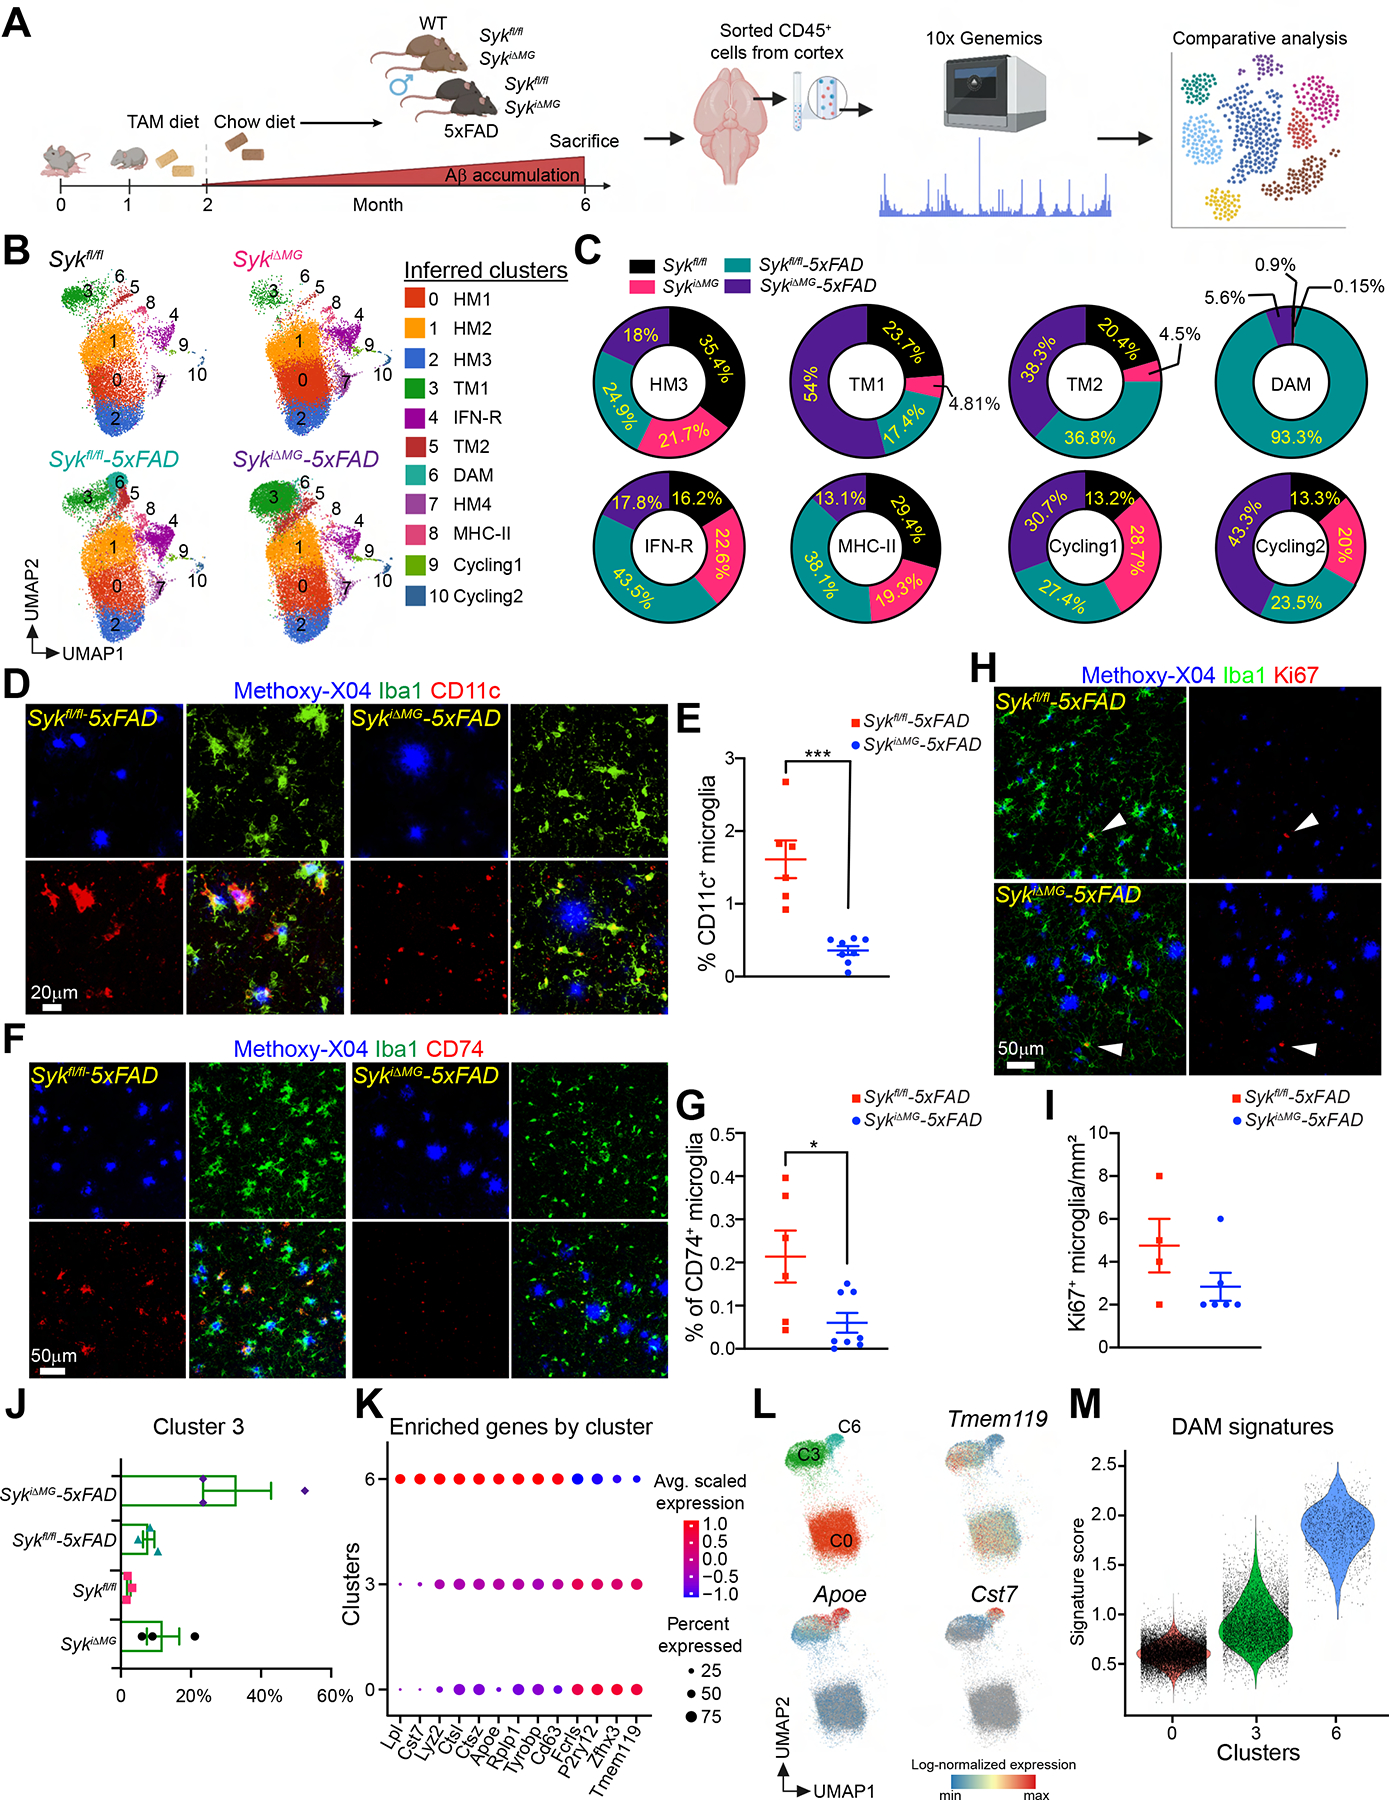
Figure 4. SYK deficiency in microglia hampers microglial activation in 5×FAD mice.

(A) Schematic of the experimental design.
(B) UMAP plots of microglia from each genotype (n = 3 mice/genotype). Cluster annotation based on expression of signature genes shown in Figure S5.
(C) Proportional contribution of each genotype to designated clusters.
(D and F) Representative confocal images of methoxy-X04, Iba-1 and CD11c or CD74 staining in the cortex of 6-month-old Sykfl/fl-5×FAD and SykiΔMG-5×FAD mice.
(E and G) Percentage of CD11c+ or CD74+ microglia in the cortex of each genotype. Data points represent the average of two technical repeats (one experiment; n = 6–8 mice/genotype).
(H) Representative confocal images of methoxy-X04, Iba-1, and Ki67 in the cortex of 6-month-old Sykfl/fl-5×FAD and SykiΔMG-5×FAD mice.
(I) Quantification of Ki67+ microglia from indicated mice. Data points represent the average of two technical repeats (representative of two independent experiments; white arrows indicate Ki67+ microglia; n = 4–6 mice/genotype).
(J) Relative abundance of cluster 3 (TM1) in all genotypes.
(K) Average scaled expression levels of selected signature genes for clusters 0 (HM1), 3 (TM1) and 6 (DAM).
(L) UMAP plots showing enrichment of selected signature in clusters 0 (HM1), 3 (TM1) and 6 (DAM).
(M) Violin plots of the DAM signature scores in clusters 0 (HM1), 3 (TM1) and 6 (DAM).
*, P < 0.05; ***, P < 0.001 by two-tailed unpaired Student’s t test. Data are presented as mean ± SEM.
See also Figure S5 and S6 in the supplemental information.
