
Figure 6. DAP10 activates microglia independently of SYK.
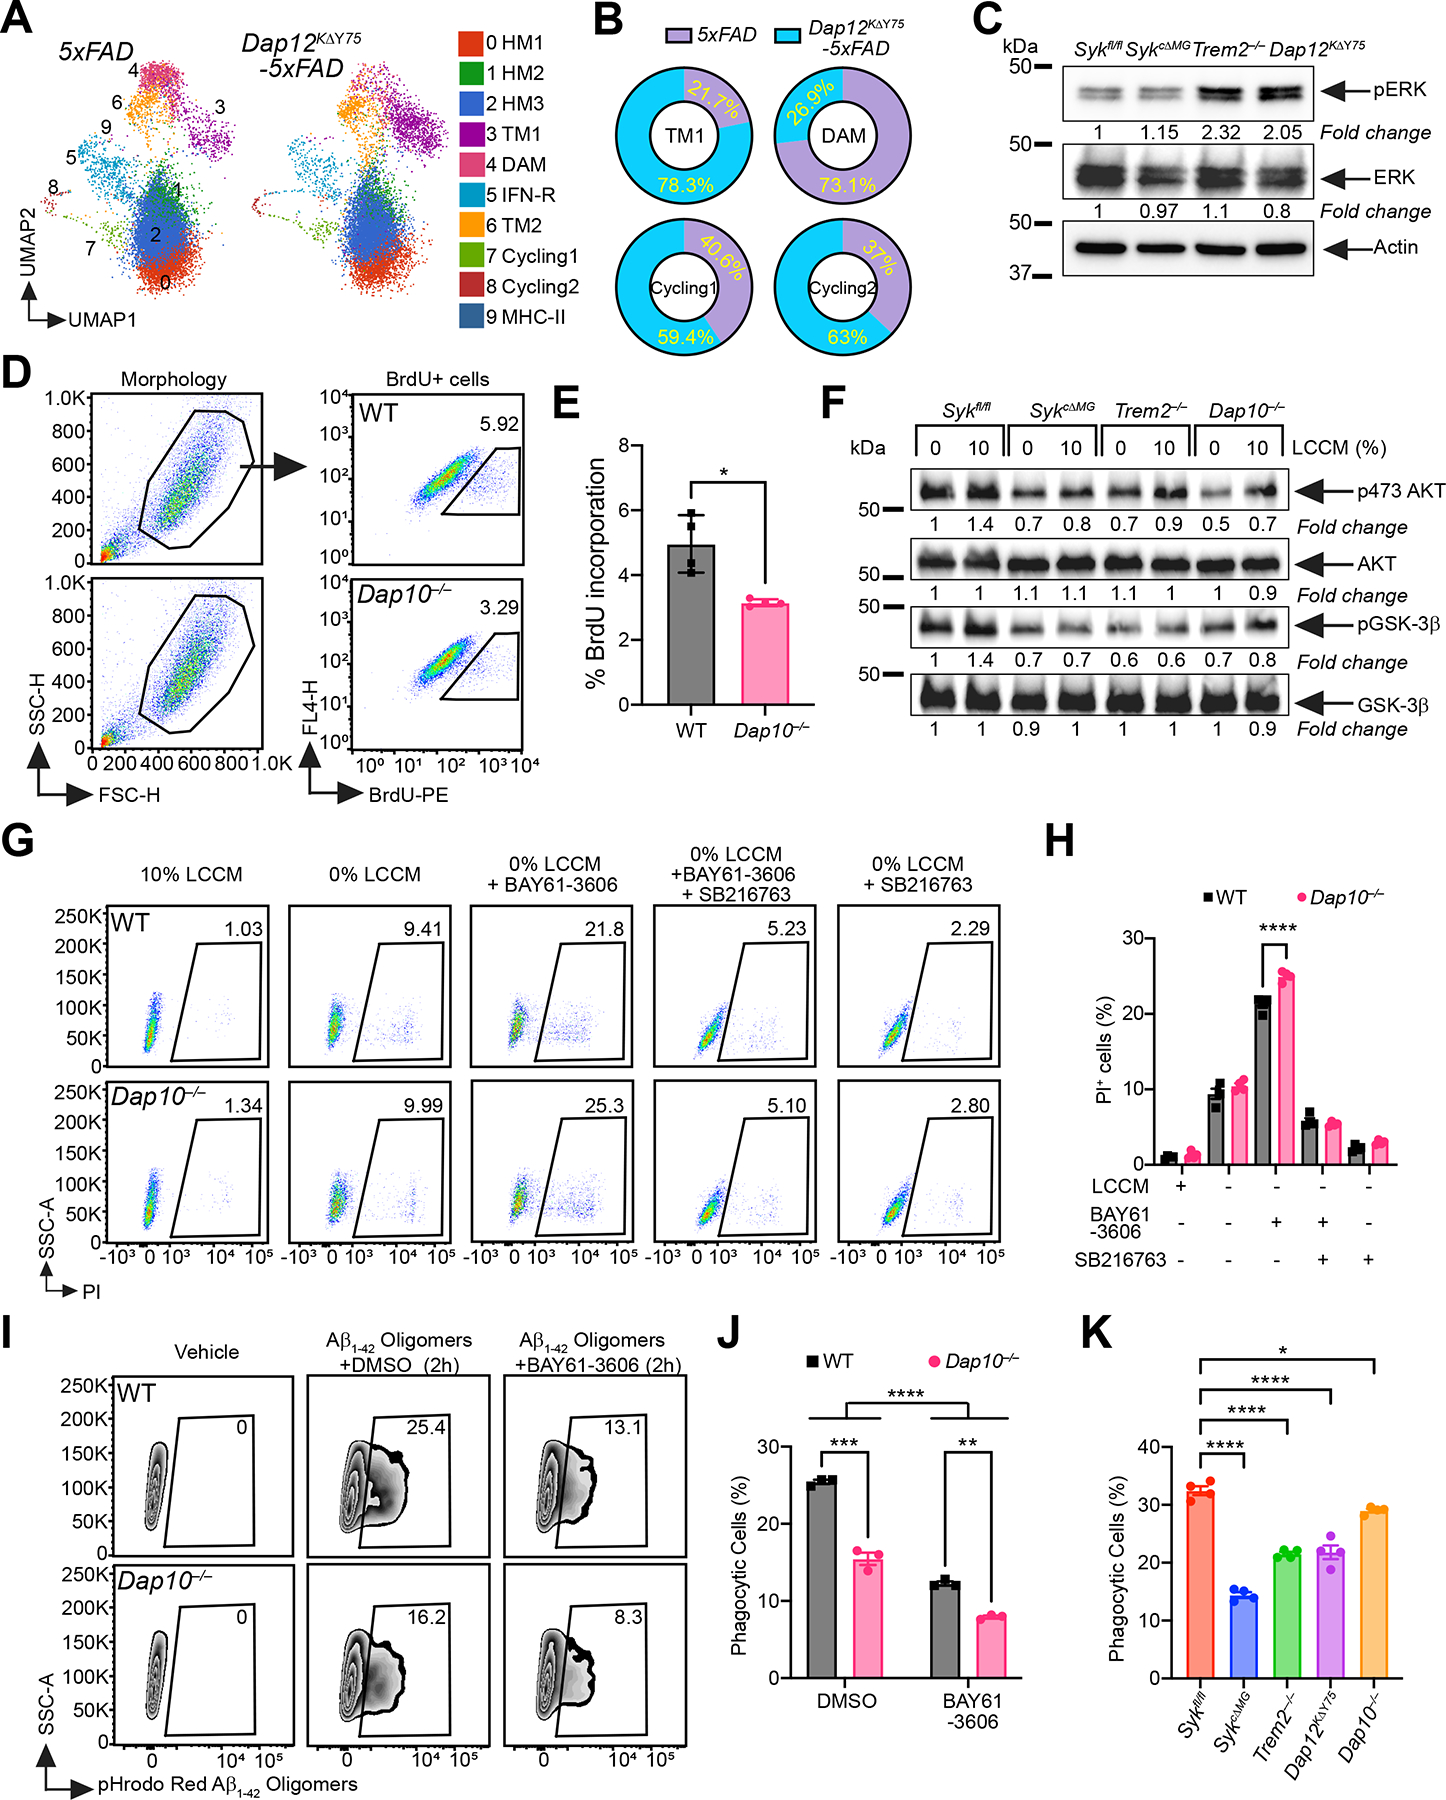
(A) UMAP plots of microglia from each genotype (n = 3–4 mice/genotype). Cluster annotation based on expression of signature genes shown in Figure 5B and S5.
(B) Proportional contribution of each genotype to designated clusters.
(C) Immunoblots of ERK and pERK on BMDM from indicated genotypes. Representative of two independent experiments.
(D) Representative FACS plots of BrdU staining on WT and Dap10−/− primary microglia.
(E) Percentage of BrdU+ microglia in each genotype. Representative of three independent experiments (n = 4 technical repeats/genotype).
(F) Immunoblots of AKT, pSer473 AKT, GSK3-β and pGSK3-β on cultured primary microglia from indicated genotypes, with or without 10% LCCM stimulation. Representative of two independent experiments.
(G) Representative FACS plots of PI staining on WT and Dap10−/− BMDM, cultured 48 hours under five different conditions: 1) 10% LCCM; 2) 0% LCCM; 3) 0% LCCM + BAY61–3606 (SYK inhibitor); 4) 0% LCCM + BAY61–3606 + SB216763 (GSK-3β inhibitor); 5) 0% LCCM + SB216763.
(H) Percentage of dead BMDMs in each genotype, at the indicated conditions. Representative of three independent experiments (n = 4 technical repeats/group).
(I) Representative FACS plots of WT and Dap10−/− BMDMs cultured with pHrodo-Red labeled Aβ1–42 for 2 hours, with or without SYK inhibitor.
(J) Quantification of Aβ1–42 uptake by BMDMs from each genotype, with or without SYK inhibitor. Representative of three independent experiments (n = 3 technical repeats/group).
(K) Same experiment as in (I and J), on BMDMs of indicated genotypes. Representative of three independent experiments (n = 4 technical repeats/genotype).
*, P < 0.05; **, P < 0.01; ***, P < 0.001; ****, P < 0.0001 by two-tailed unpaired Student’s t test (E), two-way ANOVA with Sidak’s multiple comparisons test (H and J), or one-way ANOVA with Tukey’s multiple comparisons test (K). Data are presented as mean ± SEM.