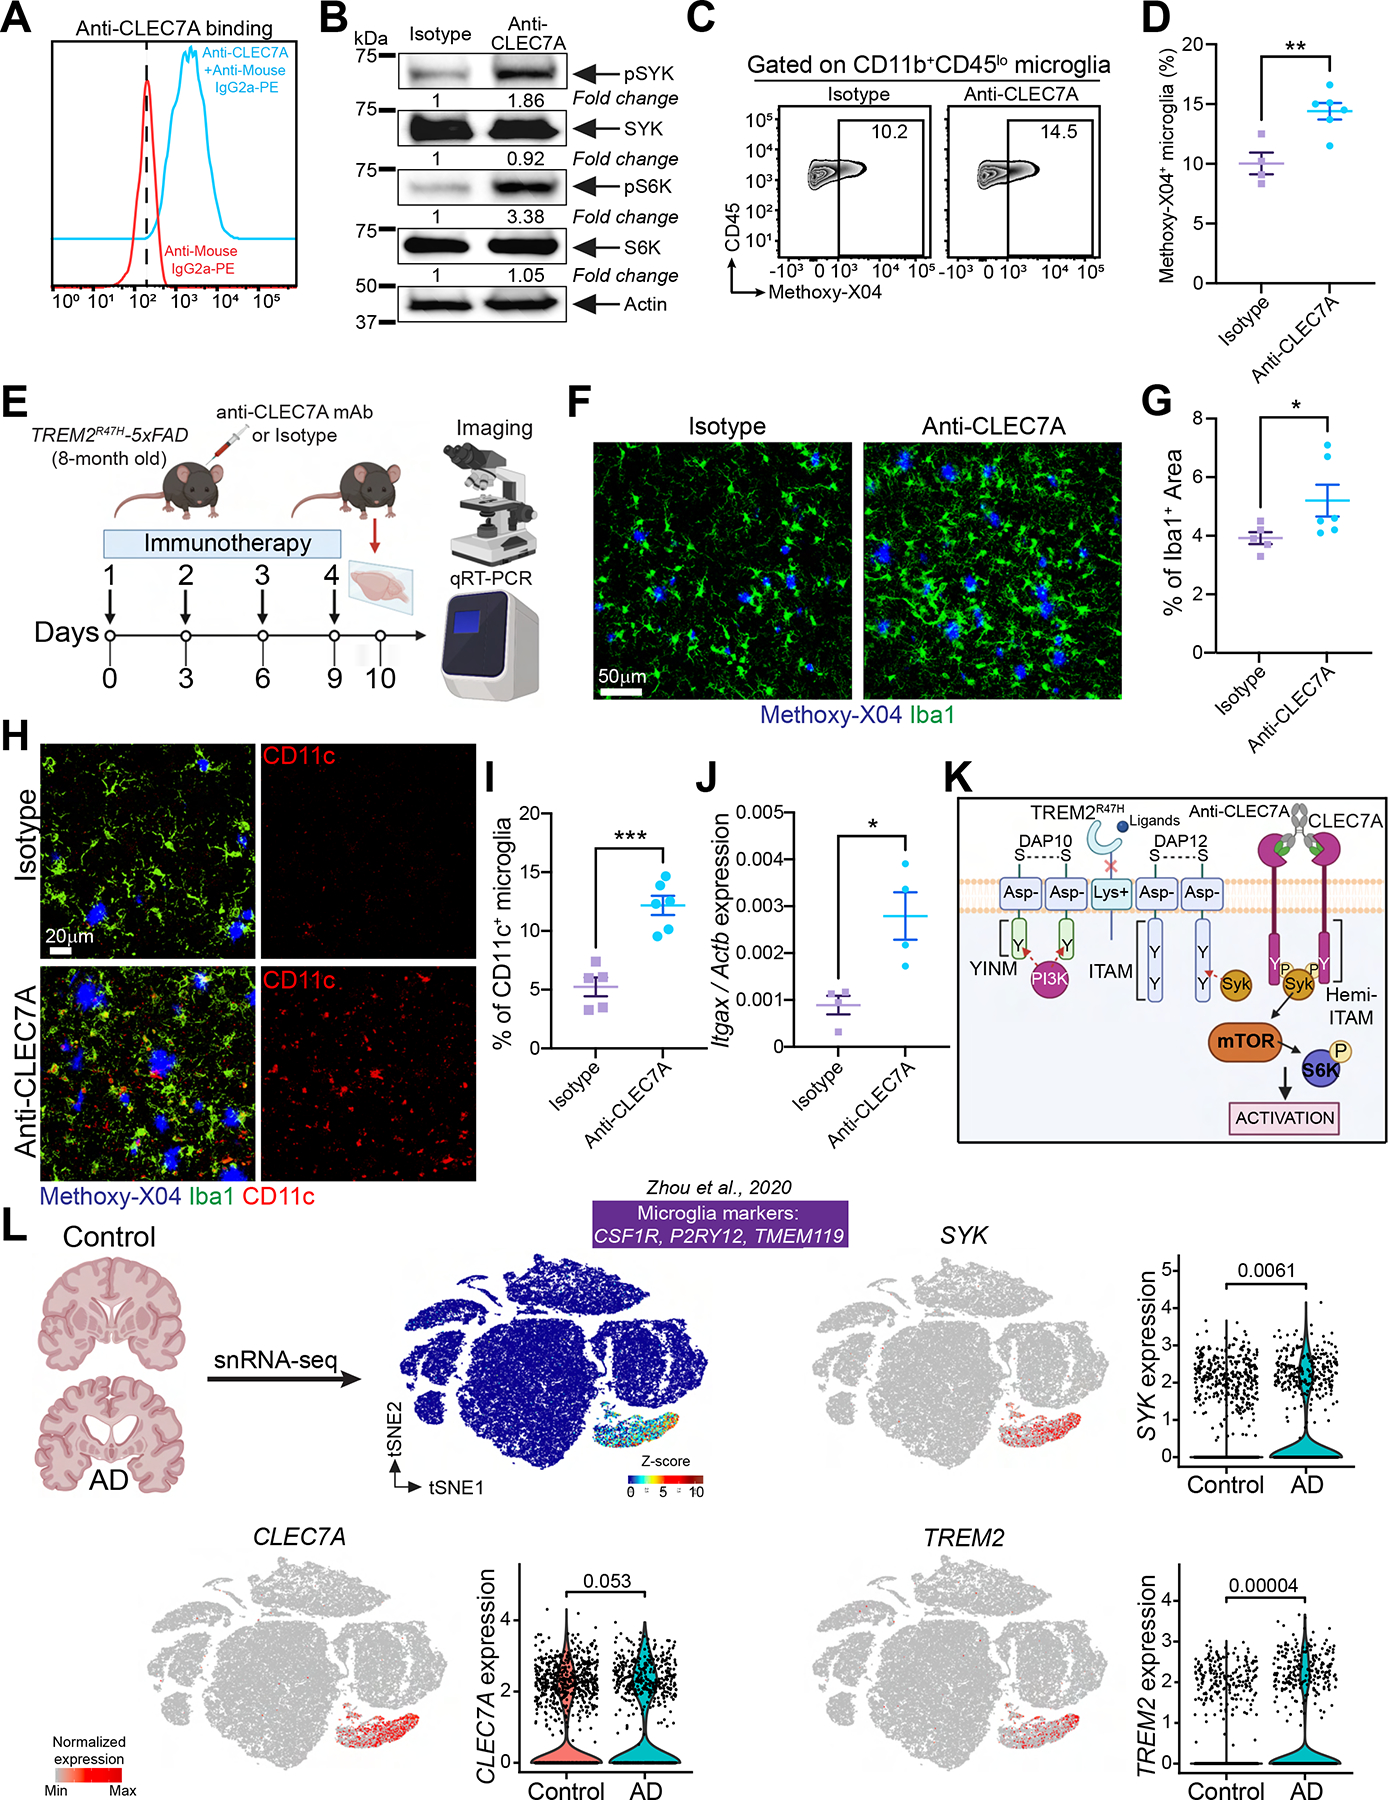
Figure 7. Acute treatment with anti-CLEC7A induces microglial activation in TREM2R47H-5×FAD mice.

(A) Cultured WT primary microglia from P4 neonates stained with anti-CLEC7A. Cells stained only with secondary Ab served as negative control. Representative of three independent experiments.
(B) Immunoblot of SYK, pSYK, S6K and pS6K on primary microglia treated with either isotype control or anti-CLEC7A. Representative of two independent experiments.
(C) Representative FACS plots of methoxy-X04+ microglia from TREM2R47H-5×FAD mice, injected ip. with either isotype control or anti-CLEC7A. WT mice served as a negative control to set the methoxy-X04+ gate.
(D) Percentage of methoxy-X04+ microglia in the tested groups (two independent experiments; n = 4–6 mice/group).
(E) Schematic of the experimental design.
(F) Representative confocal images of Iba1 and methoxy-X04 staining in the cortex of TREM2R47H-5×FAD mice injected with either isotype control or anti-CLEC7A.
(G) Percentage of Iba1+ area in the tested groups. Data points represent the average of two technical repeats (one experiment; n = 5–6 mice/group).
(H) Representative confocal images of methoxy-X04, Iba-1 and CD11c in the cortex of TREM2R47H-5×FAD mice injected with either isotype control or anti-CLEC7A.
(I) Percentage of CD11c+ microglia in the tested groups. Data points represent the average of two technical repeats (one experiment; n = 5–6 mice/group).
(J) Itgax mRNA levels assessed by qRT-PCR in whole cortical tissue from TREM2R47H-5×FAD mice injected with either isotype control or anti-CLEC7A (one experiment; n = 4 mice/group).
(K) Cartoon summarizing the hypothetical pharmacodynamics of anti-CLEC7A in microglia.
(L) tSNE plots of human brain cells from AD patients and control subjects analyzed by snRNA-seq. Expression of SYK, CLEC7A and TREM2 is displayed.
*, P < 0.05, **, P < 0.01, ***, P < 0.001 by two-tailed unpaired Student’s t test (D, G, I and J), or Wilcoxon rank-sum test (L). Data are presented as mean ± SEM.
See also Figure S7 in the supplemental information.
