. 2022 Nov 1;11:e79027. doi: 10.7554/eLife.79027

Figure 2. Feedback on the previous trial (n-1) modulates network-wide activity and hippocampal connectivity in subsequent trials (n).

(A) Voxel-wise analysis. Activity in each trial was modeled with a separate regressor as a function of feedback received in the previous trial. Insert zooming in on hippocampus added. (B) Independent regions-of-interest analysis for the anterior (ant.) and posterior (post.) hippocampus. We plot the beta estimates obtained for the contrast between low-accuracy vs. high-accuracy feedback. Negative values indicate that smaller errors, and higher-accuracy feedback, led to stronger activity. Depicted are the mean and SEM across participants (black dot and line) overlaid on single participant data (coloured dots; n=34). Activity in the anterior hippocampus is modulated by feedback received in previous trial. Statistics reflect p<0.05 at Bonferroni-corrected levels (*) obtained using a group-level two-tailed one-sample t-test against zero. (C) Feedback-dependent hippocampal connectivity. We plot results of a psychophysiological interactions (PPI) analysis conducted using the hippocampal peak effects in (A) as a seed for low vs. high-accuracy feedback. (AC) We plot thresholded t-test results at 1 mm resolution overlaid on a structural template brain. MNI coordinates added. Hippocampal activity and connectivity is modulated by feedback received in the previous trial.

Figure 2.

Figure 2—figure supplement 1. Regions of interest (ROIs).

Figure 2—figure supplement 1.

(A) Anterior and posterior hippocampal ROIs. (B) Subcortical regions-of-interest (ROIs) for the nucleus accumbens, the amygdala, the thalamus, the caudate, the putamen and the pallidum. (AB) ROIs shown for a sample participant superimposed onto the skull-stripped structural T1-scan of that participant. These masks were created using FreeSurfer’s cortical and subcortical parcellation.
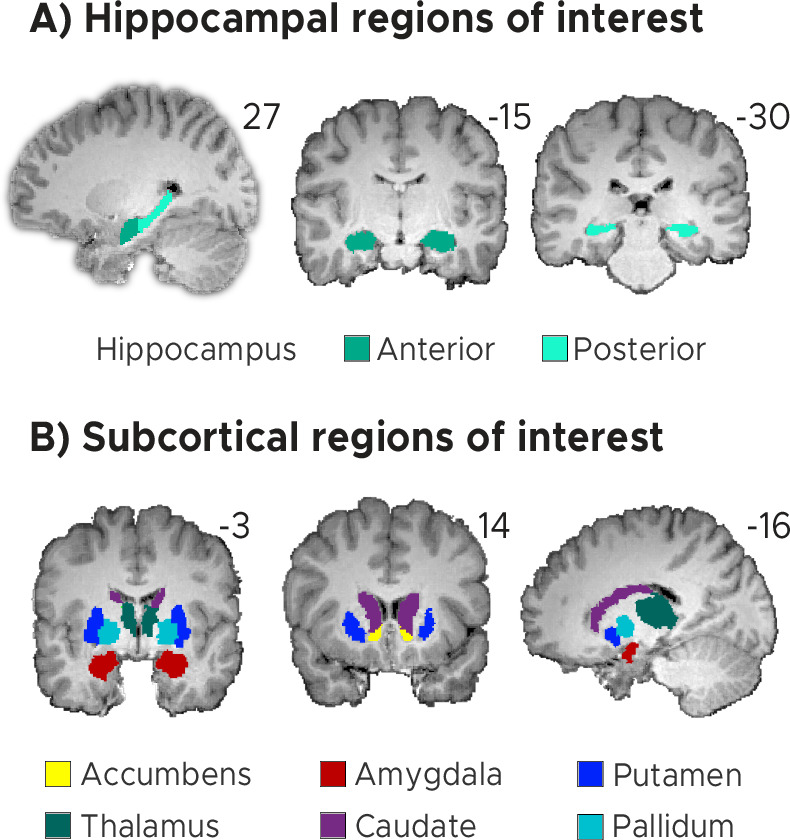
Figure 2—figure supplement 2. Current trial effects.

Figure 2—figure supplement 2.

(A) Brain regions signaling behavioral feedback in current trial. Activity in each trial was modeled parametrically as a function of the feedback received at the end of the trial. (B) Independent regions-of-interest analysis for the anterior (ant.) and posterior (post.) hippocampus. We plot the beta estimate obtained for the parametric modulator modeling trial-wise activity as a function of feedback received at the end of the trial. Negative values indicate that smaller errors, and higher-accuracy feedback, led to stronger activity. (C) Brain regions signaling task performance in current trial. Activity in each trial was modeled parametrically as a function of the absolute difference between estimated and true TTC. (D) Independent regions-of-interest analysis for the anterior (ant.) and posterior (post.) hippocampus. We plot the beta estimate obtained for the parametric modulator modeling trial-wise activity as a function of task performance. Negative values indicate that better task performance led to stronger activity. (AC) Voxel-wise analysis. We plot thresholded t-test results at 1 mm resolution overlaid on a structural template brain. MNI coordinates added. (BD) Depicted are the means and SEM across participants (black dot and line) overlaid on single participant data (coloured dots; n=34). Statistics reflect p<0.05 at Bonferroni-corrected levels (*) obtained using a group-level two-tailed one-sample t-test against zero.
Figure 2—figure supplement 3. Brain activity reflects feedback received in past trial.

Figure 2—figure supplement 3.

(A) Activity in each trial was modeled with three separate regressors for each feedback level received in the previous trial. Left: Independent regions-of-interest analysis for the anterior (ant.) and posterior (post.) hippocampus. We plot the beta estimates obtained for the contrast between low-accuracy vs. high-accuracy feedback. Negative values indicate that smaller errors, and higher-accuracy feedback, led to stronger activity. Depicted are the mean and SEM across participants (black dot and line) overlaid on single participant data (coloured dots; n=34). Statistics reflect p<0.05 at Bonferroni-corrected levels (*) obtained using a group-level two-tailed one-sample t-test against zero. Right: Voxel-wise analysis. (B) Same as in A, but without modeling Inter-Trial-Intervals (ITI) and Inter-Session-Intervals (ISI). (C) Same as in A, but modeling the three previous trial feedback levels with one parametric regressor. (ABC) We plot thresholded t-test results at 1 mm resolution overlaid on a structural template brain. MNI coordinates added.
Figure 2—figure supplement 4. Remaining contrasts from Figure 2A, Figure 2B.

Figure 2—figure supplement 4.

Activity in each trial was modeled with three separate regressors for each feedback level received in the previous trial. (A) Left: Independent regions-of-interest analysis for the anterior (ant.) and posterior (post.) hippocampus. We plot the beta estimates obtained for the contrast between low-accuracy vs. medium-accuracy feedback. Negative values indicate that medium errors, and medium-accuracy feedback, led to stronger activity. Depicted are the mean and SEM across participants (black dot and line) overlaid on single participant data (coloured dots; n=34). Statistics reflect p<0.05 at Bonferroni-corrected levels (*) obtained using a group-level two-tailed one-sample t-test against zero. Right: Voxel-wise analysis. (B) Left: Same as in A, but we plot instead the beta estimates obtained for the contrast between medium-accuracy vs. high-accuracy feedback. Negative values indicate that smaller errors, and high-accuracy feedback, led to stronger activity. Right: Voxel-wise analysis. (AB) We plot thresholded t-test results at 1 mm resolution overlaid on a structural template brain. MNI coordinates added.