
Author response image 1. Left: Effect of task performance modeled with one parametric regressor (Figure 2—figure supplement 2).
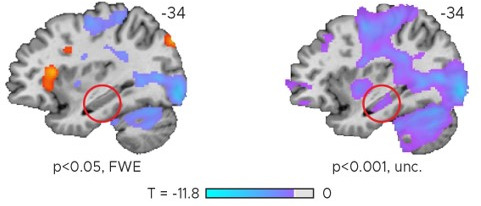
Right: Same data as on the left but plotted at a more liberal, uncorrected threshold. Only negative t-scores shown on the right.