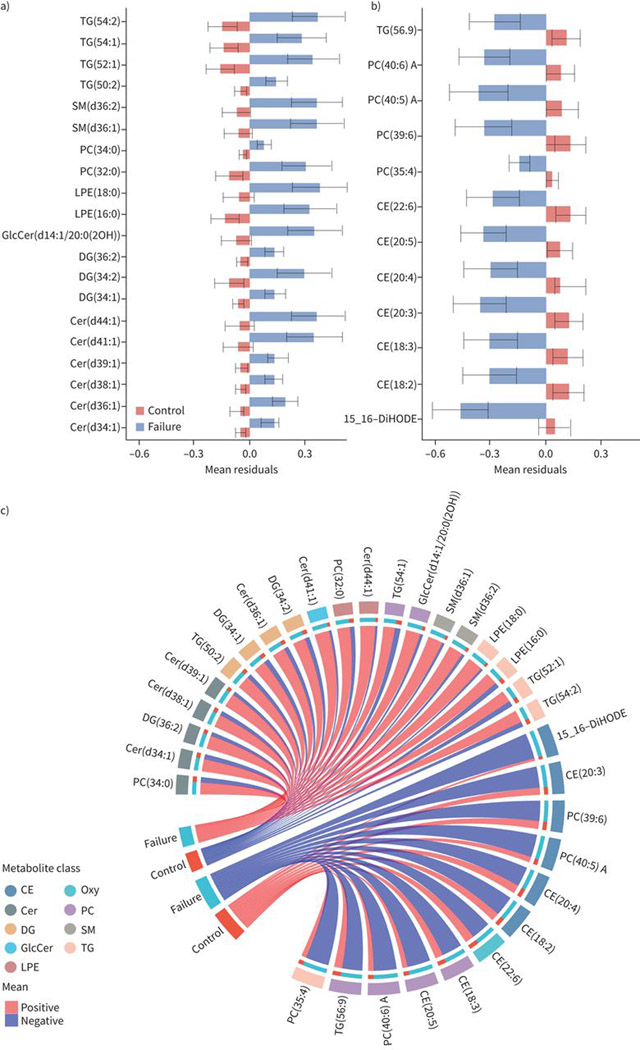
FIGURE 1.
Baseline levels of individual lipids associated with tuberculosis treatment failure. Barplots showing average baseline levels of mean±SE of residuals for individual lipids that are significantly a) higher or b) lower in treatment failure compared to controls. The x-axes show the mean residuals after adjusting for body mass index, age, study site, sex, diabetes, alcohol, smoking and HIV status. Differences are considered significant if their false discovery rate-adjusted p-values <0.05. c) Circular plots showing the individual lipids and the lipid families that are increased or decreased at baseline among failures compared to controls. TG: triacylglycerol; SM: sphingomyelin; PC: phosphatidylcholine; LPE: lyso-phosphatidylethanolamine; GlcCer: glycospingolipid; DG: diacylglycerol; Cer: ceramides; CE: cholesterol esters; DiHODE: dihydroxyoctadecadienoic acid; Oxy: oxylipins.

