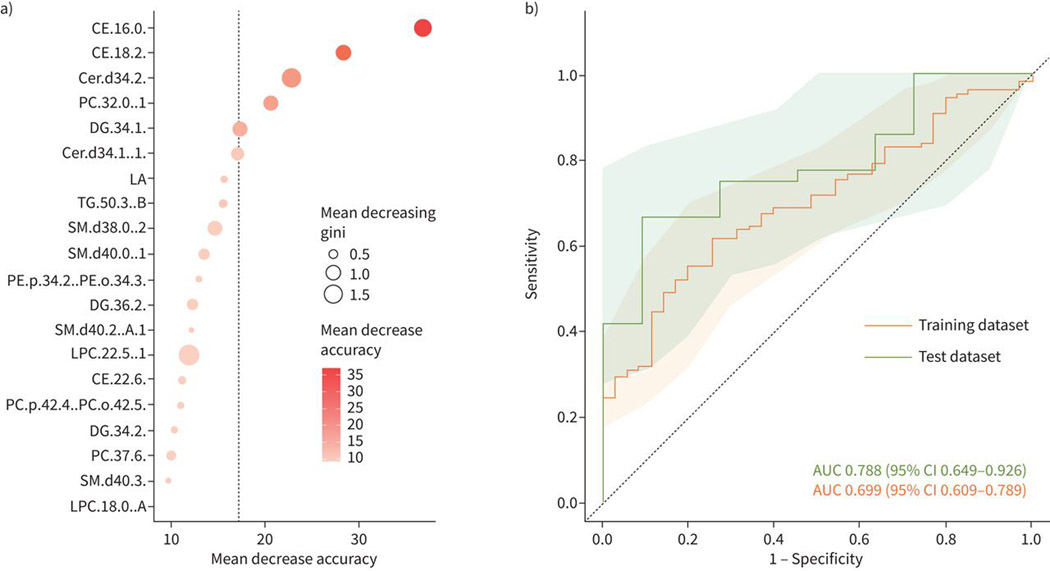
FIGURE 3.
Accuracy of prediction model. a) The dot plot shows the mean decrease accuracy and mean decreasing gini values from the random forest analysis to classify treatment failure and controls (cures). b) The lipids from the random forest model are evaluated by receiver operating characteristic curve. The area under the curve (AUC) for the training and test datasets are shown and the shaded area shows the confidence intervals of the AUCs.

