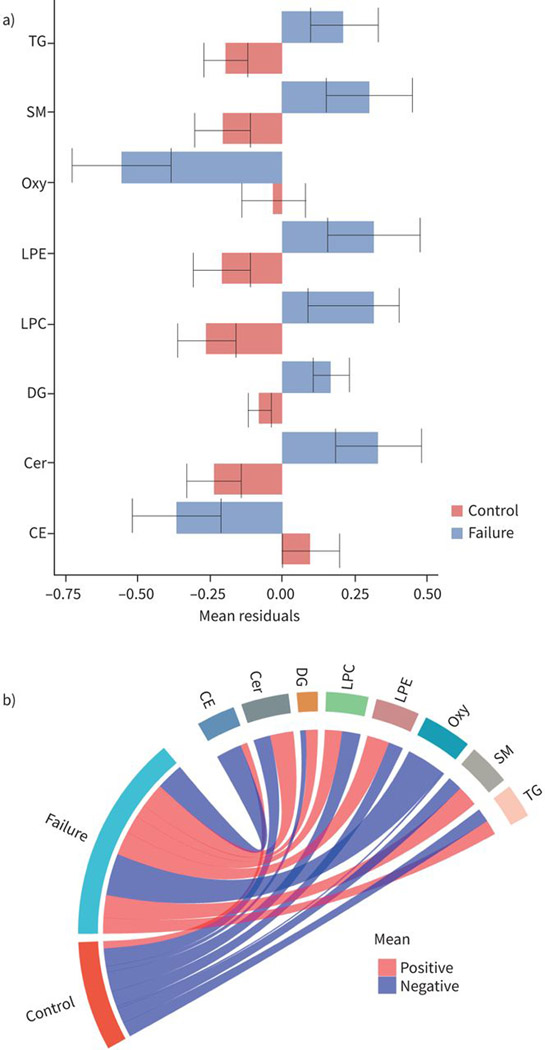
FIGURE 5.
Baseline levels of lipid families associated with tuberculosis (TB) treatment failure in subset analysis. Barplots showing baseline levels of mean and standard errors of residuals for lipid families that are significantly a) higher or b) lower in treatment failure compared to controls in subset analysis. The subset analysis was limited to those with culture or Xpert-confirmed pulmonary TB diagnosis at baseline as well as culture-confirmed outcomes (failure or cure). The x-axis shows the mean residuals (sum of residuals of each individual lipid in the lipid family) after adjusting for body mass index, age, study site, sex, diabetes, alcohol, smoking and HIV status. Differences are considered significant if their false discovery rate-adjusted p-values <0.05. c) Circular plots showing the lipids families that are increased or decreased at baseline among failures compared to controls. TG: triacylglycerol; SM: sphingomyelin; Oxy: oxylipin; LPE: lyso-phosphatidylethanolamine; LPC: lyso-phosphatidylcholine; DG: diacylglycerol; Cer: ceramide; CE: cholesterol ester.

