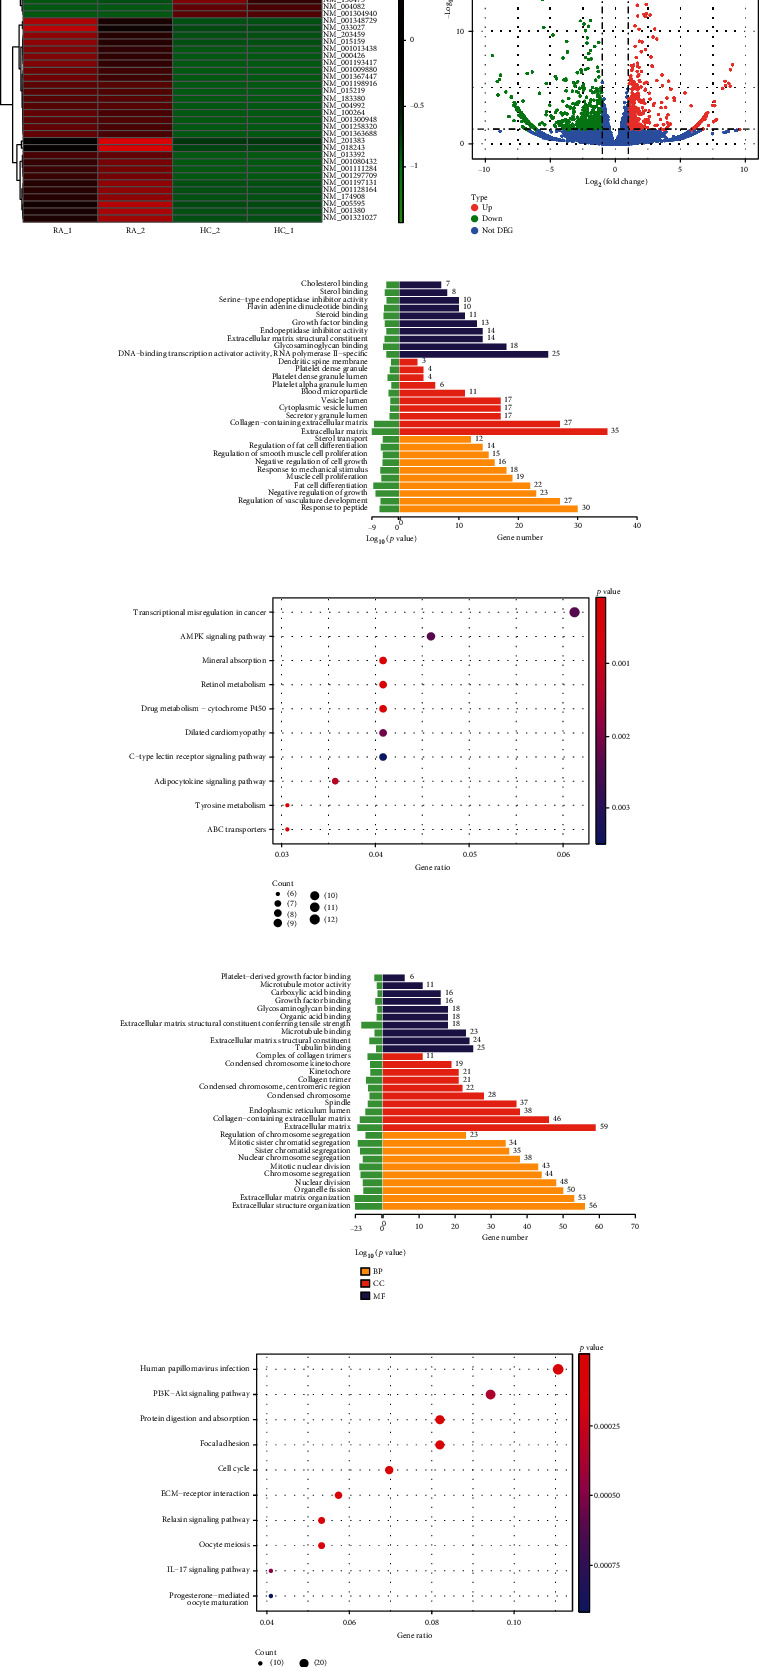
Figure 1.

Transcriptome information analysis of differentially expressed mRNA in the RA synovium. (a) Clustering heatmap of differentially expressed genes. (b) Volcano plot of differentially expressed genes. (c) Upregulated mRNAs subjected to GO. (d) KEGG entries for parental genes of the top 10 significantly upregulated transcripts. (e) GO analysis of downregulated genes. (f) KEGG entries for parental genes of the top 10 significantly downregulated transcripts.
