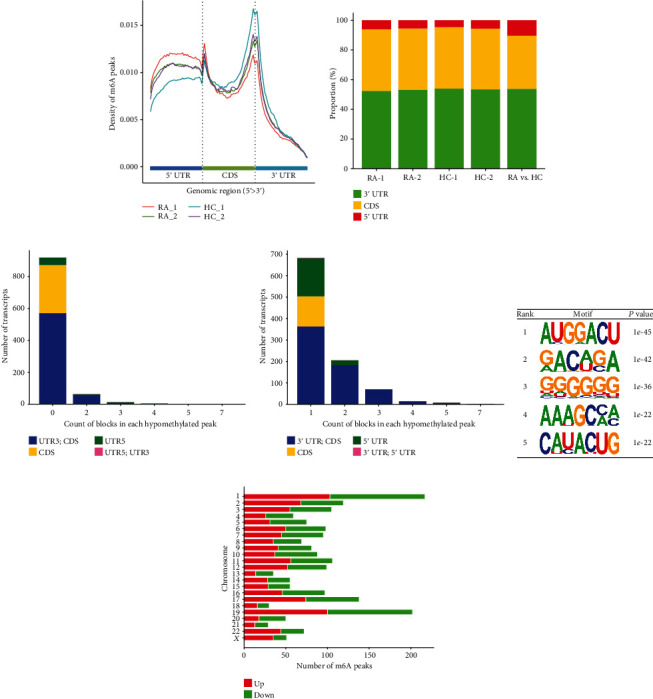
Figure 2.

The distribution of m6A-modified epitranscriptomes. (a) Distribution of the peak in the 5'UTR, CDS, and 3'UTR regions. (b) The proportion of differentially methylated peaks in the 5'UTR, CDS, and 3'UTR regions. Counts of peaks whose methylation modifications were (c) downregulated or (d) upregulated in each region. (e) Top 5 m6A-modified motif sequences. (f) Distribution of the genes corresponding to significantly different m6A modification sites in human chromosomes.
