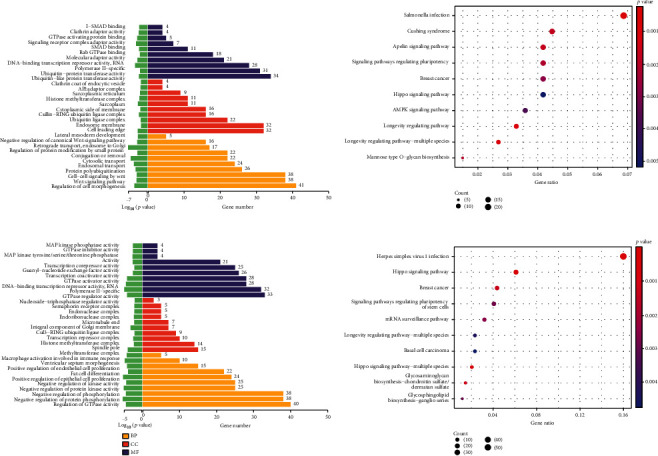
Figure 3.

KEGG and GO analysis of m6A-modified epitranscriptome. (a) GO analysis of the upregulated genes corresponding to transcripts with significant m6A modification. (b) KEGG analysis of the upregulated genes corresponding to transcripts with significant m6A modification. (c) GO analysis of the downregulated genes corresponding to transcripts with significant m6A modification. (d) KEGG analysis of transcripts with significant m6A modification corresponding to the downregulated genes.
