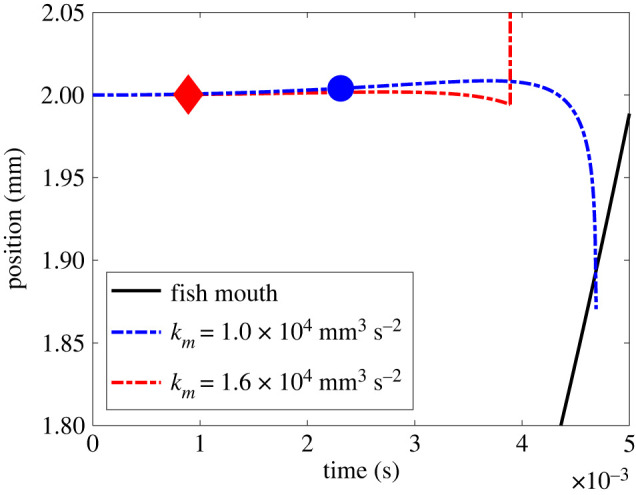
Figure 4.

Two model examples with different outcomes. Broken blue and red lines show copepod's location while the black solid line represents the fish's mouth position. Points marked by symbols represent times when the deformation rate of the water around the copepod surpasses the set threshold for reaction, kd = 1 s−1. In both cases shown, the fish accelerates by the same amount, ku = 6.3 × 104 mm s−2, and all other parameters are given in table 1. The red line shows the trial where a fish has a suction increase rate of km = 1.6 × 104 mm3 s−2, alerting the copepod at time t = 0.9 ms (red diamond) and subsequently fails to capture before the copepod reacts (tr) 3 ms later. The blue line shows the case of suction increasing at a rate of km = 1.0 × 104 mm3 s−2, which results in a more delayed alert time of t = 2.3 ms (blue circle) and does result in capture before the escape can occur.
