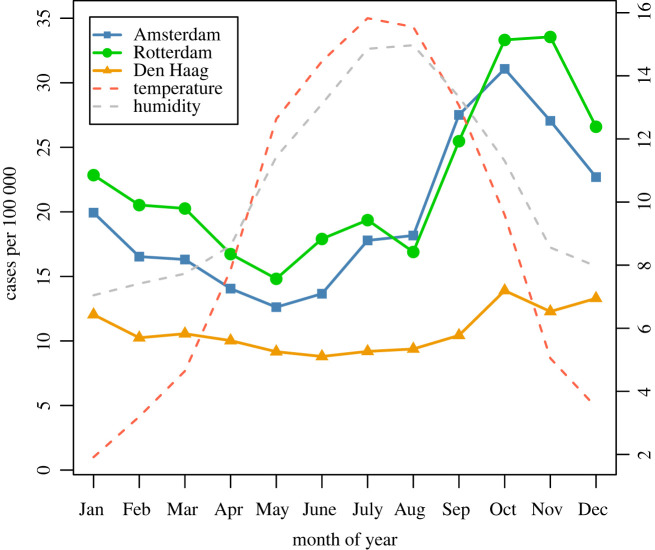
Figure 3.
Mean monthly scarlet fever cases per 100 000 (averaged over period 1906–1920), for Amsterdam, Rotterdam and Den Haag, with centrally measured temperature and absolute humidity. The right-hand y-axis applies to the two weather variables; for temperature the scale is in degrees Celsius; for humidity the scale refers to absolute humidity * 2 (in g/m−3).

