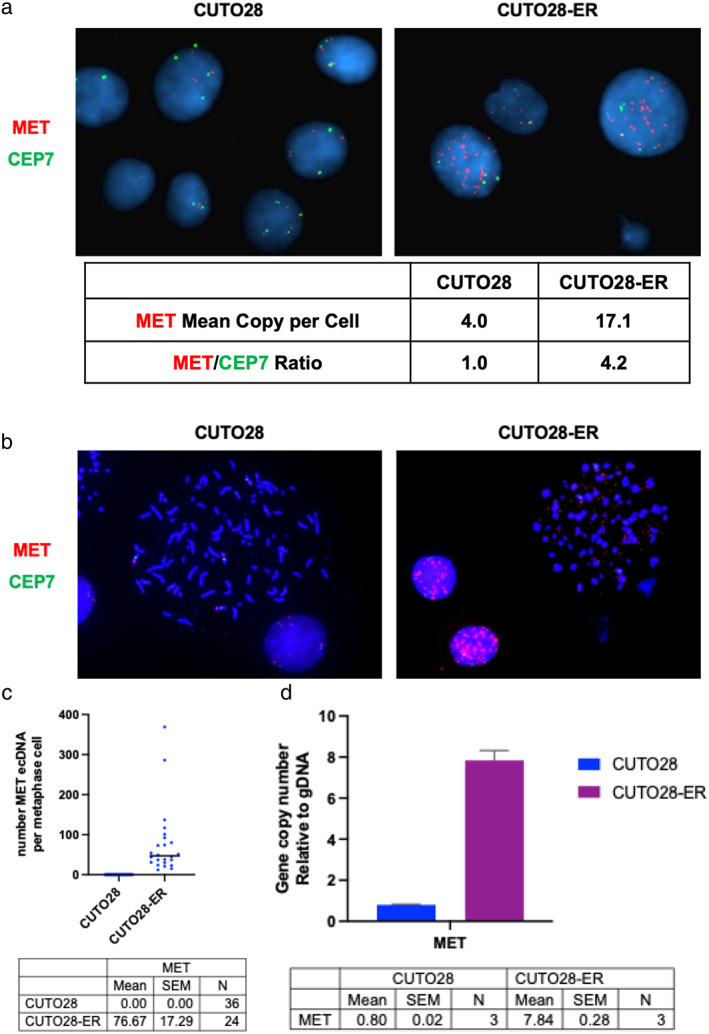
FIGURE 2.

Amplification of the MET locus drives MET overexpression in CUTO28‐ER cells. (a) Interphase florescence in situ hybridization (FISH) imaging using probes which label the MET gene (red) and its corresponding chromosome's centrosome, CEP7 (green). The ratio of MET/CEP7 copies is used as a clinical measure of focal MET gene amplification. The number of MET and CEP7 hybridization signals per cell, as well as MET/CEP7 ratio, are quantified by cell line. Images taken at 100x magnification. (b) Metaphase FISH was performed to visualize how much of this amplification was occurring outside of the genomic DNA. (c) The number of extrachromosomal MET probe hybridization signals per metaphase‐halted cell represented in panel B are quantified by cell line. (d) The ecDNA MET copy number gain relative to genomic DNA is quantified by cell line via genomic qPCR
