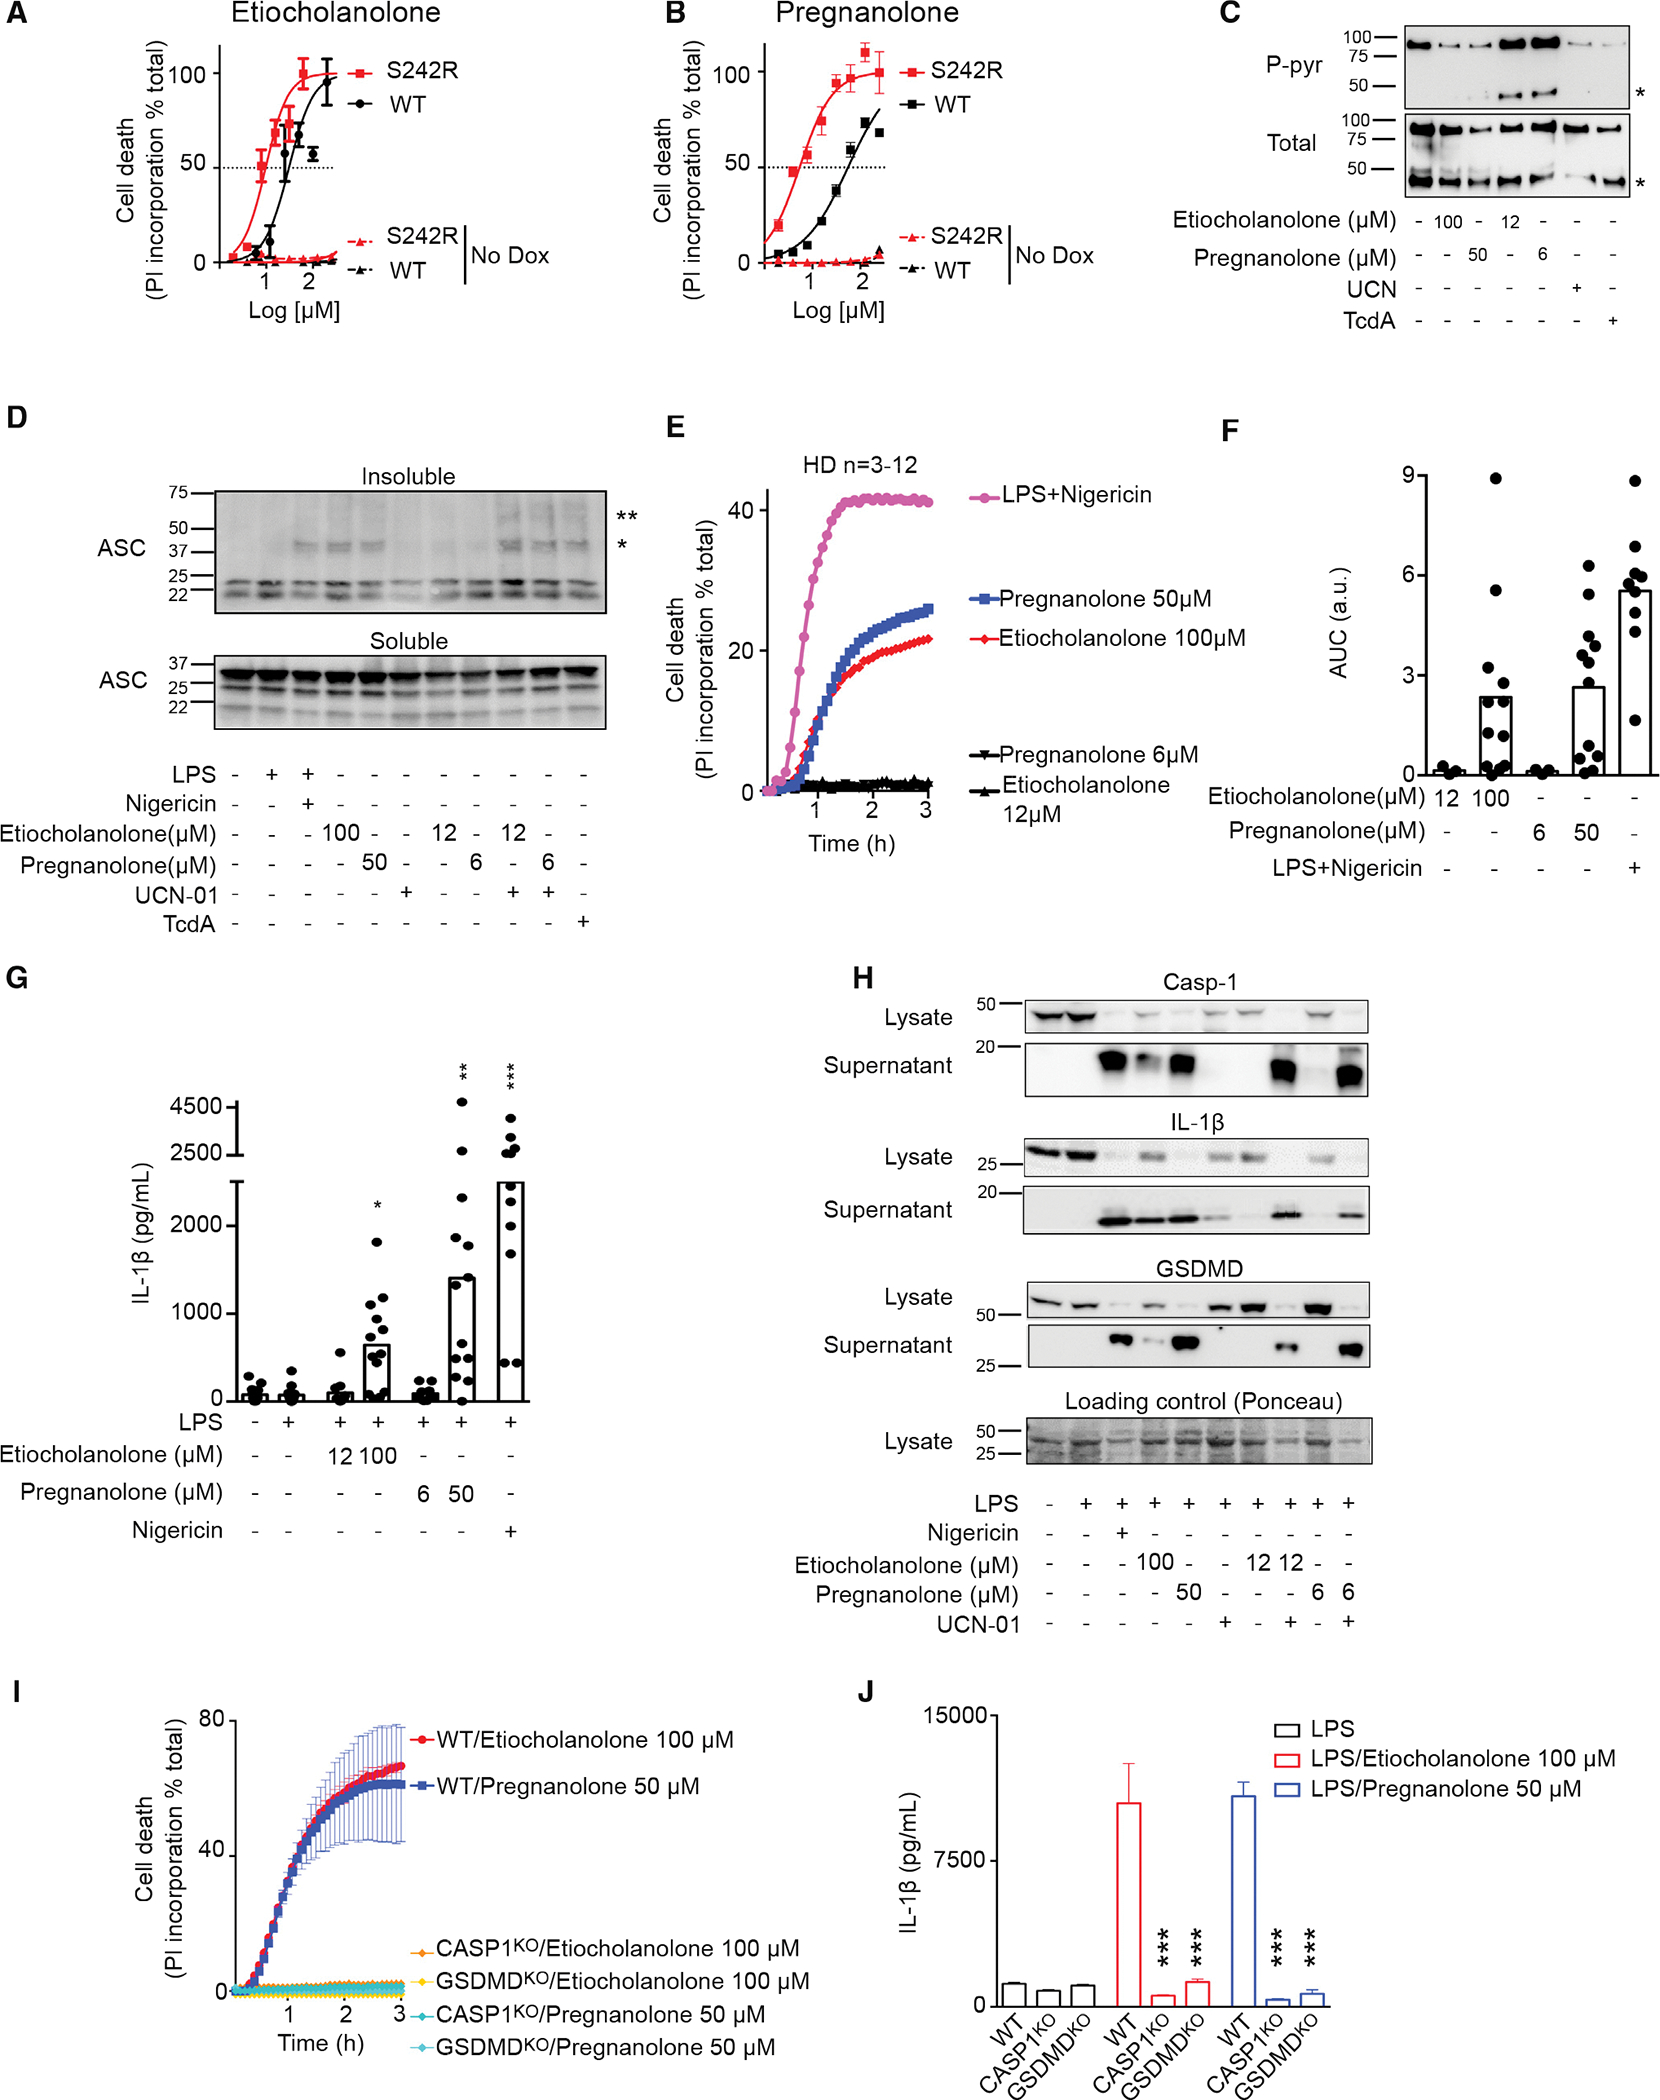
Figure 3. High concentrations of etiocholanolone and pregnanolone trigger full activation of pyrin inflammasome.

(A and B) U937 cells expressing Dox (plain lines) or not (No Dox, dotted lines) p.S242R (red) or WT (black) MEFV were treated with various concentration of etiocholanolone (A) or pregnanolone (B). Cell death was determined at 3 h post-addition.
(C) 3xFlag-WT pyrin from U937 cells treated with the indicated stimuli at the indicated concentrations was immunoprecipitated. Ser242 phosphorylation (P-pyr) and total pyrin levels were monitored by western blot. “*” indicates a cleaved form of pyrin.
(D) ASC immunoblot from U937 cells expressing WT MEFV. Cells were treated with the indicated molecules. ASC oligomers in the insoluble fraction were treated with DSS (2 mM) cross linker after lysis. ASC monomers in the soluble fraction is shown. “*” and “**” correspond to the sizes of ASC dimer and trimer, respectively.
(E) Monocytes from HDs (n = 3–12) were treated with low (black) or high concentrations of etiocholanolone (red) and pregnanolone (blue) or with LPS + nigericin (magenta). Propidium iodide (PI) incorporation was monitored every 5 min for 3 h.
(F) The corresponding area under the curve (AUC) for each donor are shown.
(G) Monocytes were primed with LPS for 3 h and exposed to the indicated stimuli at the indicated concentrations. IL-1β concentration in the supernatant was quantified at 3 h post-addition.
(H) Monocytes from one HD were primed or not with LPS for 3 h before addition of the indicated stimuli. Caspase-1, IL-1β, and GSDMD processing were analyzed by western blot in the cell lysate and supernatant at 3 h post-stimuli addition.
(I and J) (I) MEFV-expressing U937 monocytes or (J) PMA-differentiated U937 macrophages WT or knockout for CASP1 or GSDMD as indicated were treated with doxycycline during 16 h. (I) PI incorporation was monitored every 5 min for 3 h post stimuli addition. (J) Cells were primed with LPS for 3 h before addition of the indicated stimuli. IL-1β concentration in the supernatant was quantified at 3 h post-addition.
One experiment representative of three (A–C) to two (H and I) independent experiments is shown. Mean and SEM of triplicates are shown. (A and B) Non-linear regression curve computed using least squares fit method is shown. (G) Kruskal-Wallis test with Dunn’s multiple comparisons tests was performed to compare the different treatments with the LPS treatment. *p = 0.026, **p = 0.0011, ***p < 0.001. (J) One-way ANOVA analysis with Sidak’s multiple comparisons test was performed to compare WT U937 to CASP1KO or GSDMDKO cells. ***p < 0.001.
