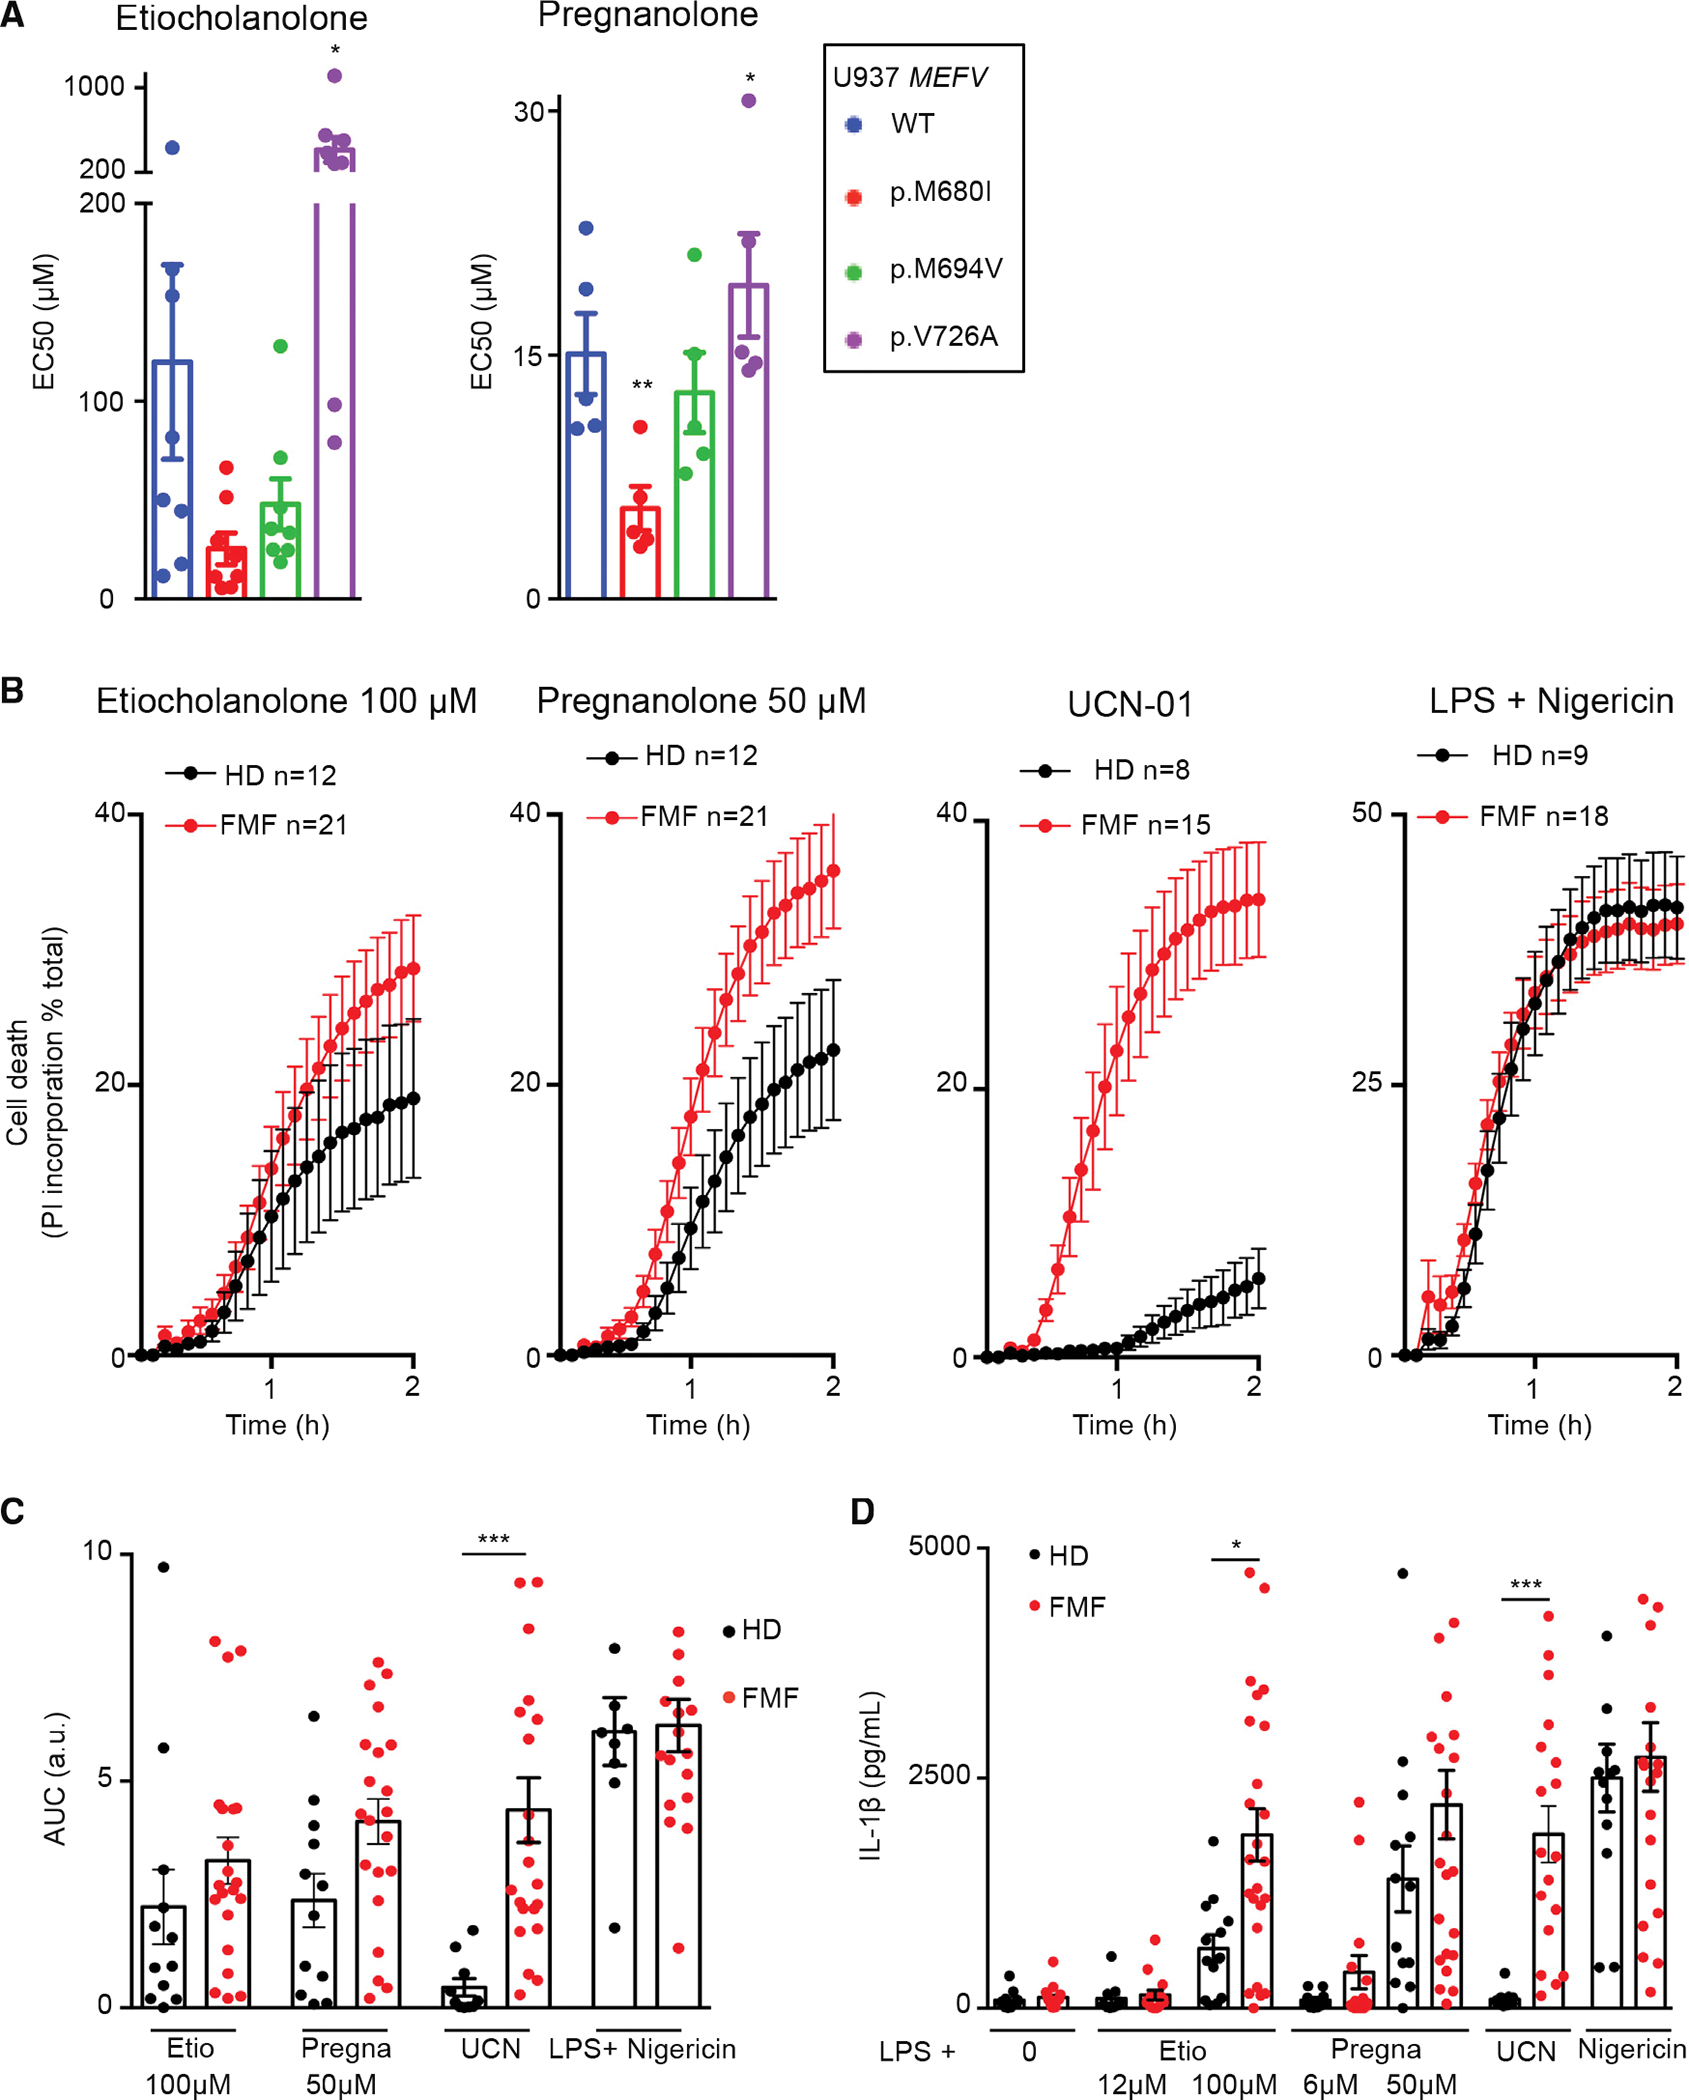
Figure 6. Monocytes from FMF patients display a moderately increased response to steroid catabolites compared with HDs.

(A) U937 expressing the indicated MEFV variant were exposed to the indicated steroid catabolite and the EC50 was determined at 3 h post-addition.
(B) Monocytes from HD (n = 8–12) or FMF patients (n = 15–21) were treated with the indicated stimuli. Propidium iodide (PI) incorporation was monitored every 5 min for 2 h.
(C) The corresponding area under the curve (AUC) are shown.
(D) IL-1β concentrations were determined at 3 h post addition of the indicated molecules.
(A) Mean and SEM of five to eight independent experiments are shown. Each dot represents the mean value of a triplicate from one experiment. RM one-way ANOVA with Dunnet’s multiple comparisons test was performed. Etio *p = 0.018; Pregna *p = 0.033 **p = 0.0042. (B) Mean and SEM of 8–21 individuals are show as indicated, each one corresponding to the average of a biological triplicate. (C) Each dot corresponds to the mean AUC of one individual performed in triplicates, the bar represents the mean of 8–21 individuals. (D) Each dot corresponds to the mean IL-1β concentrations of one individual performed in triplicates, the bar represents the mean of 8–21 individuals. (C and D) One-way ANOVA with Sidak’s multiple comparison test was applied; *p = 0.015, ***p < 0.001.
