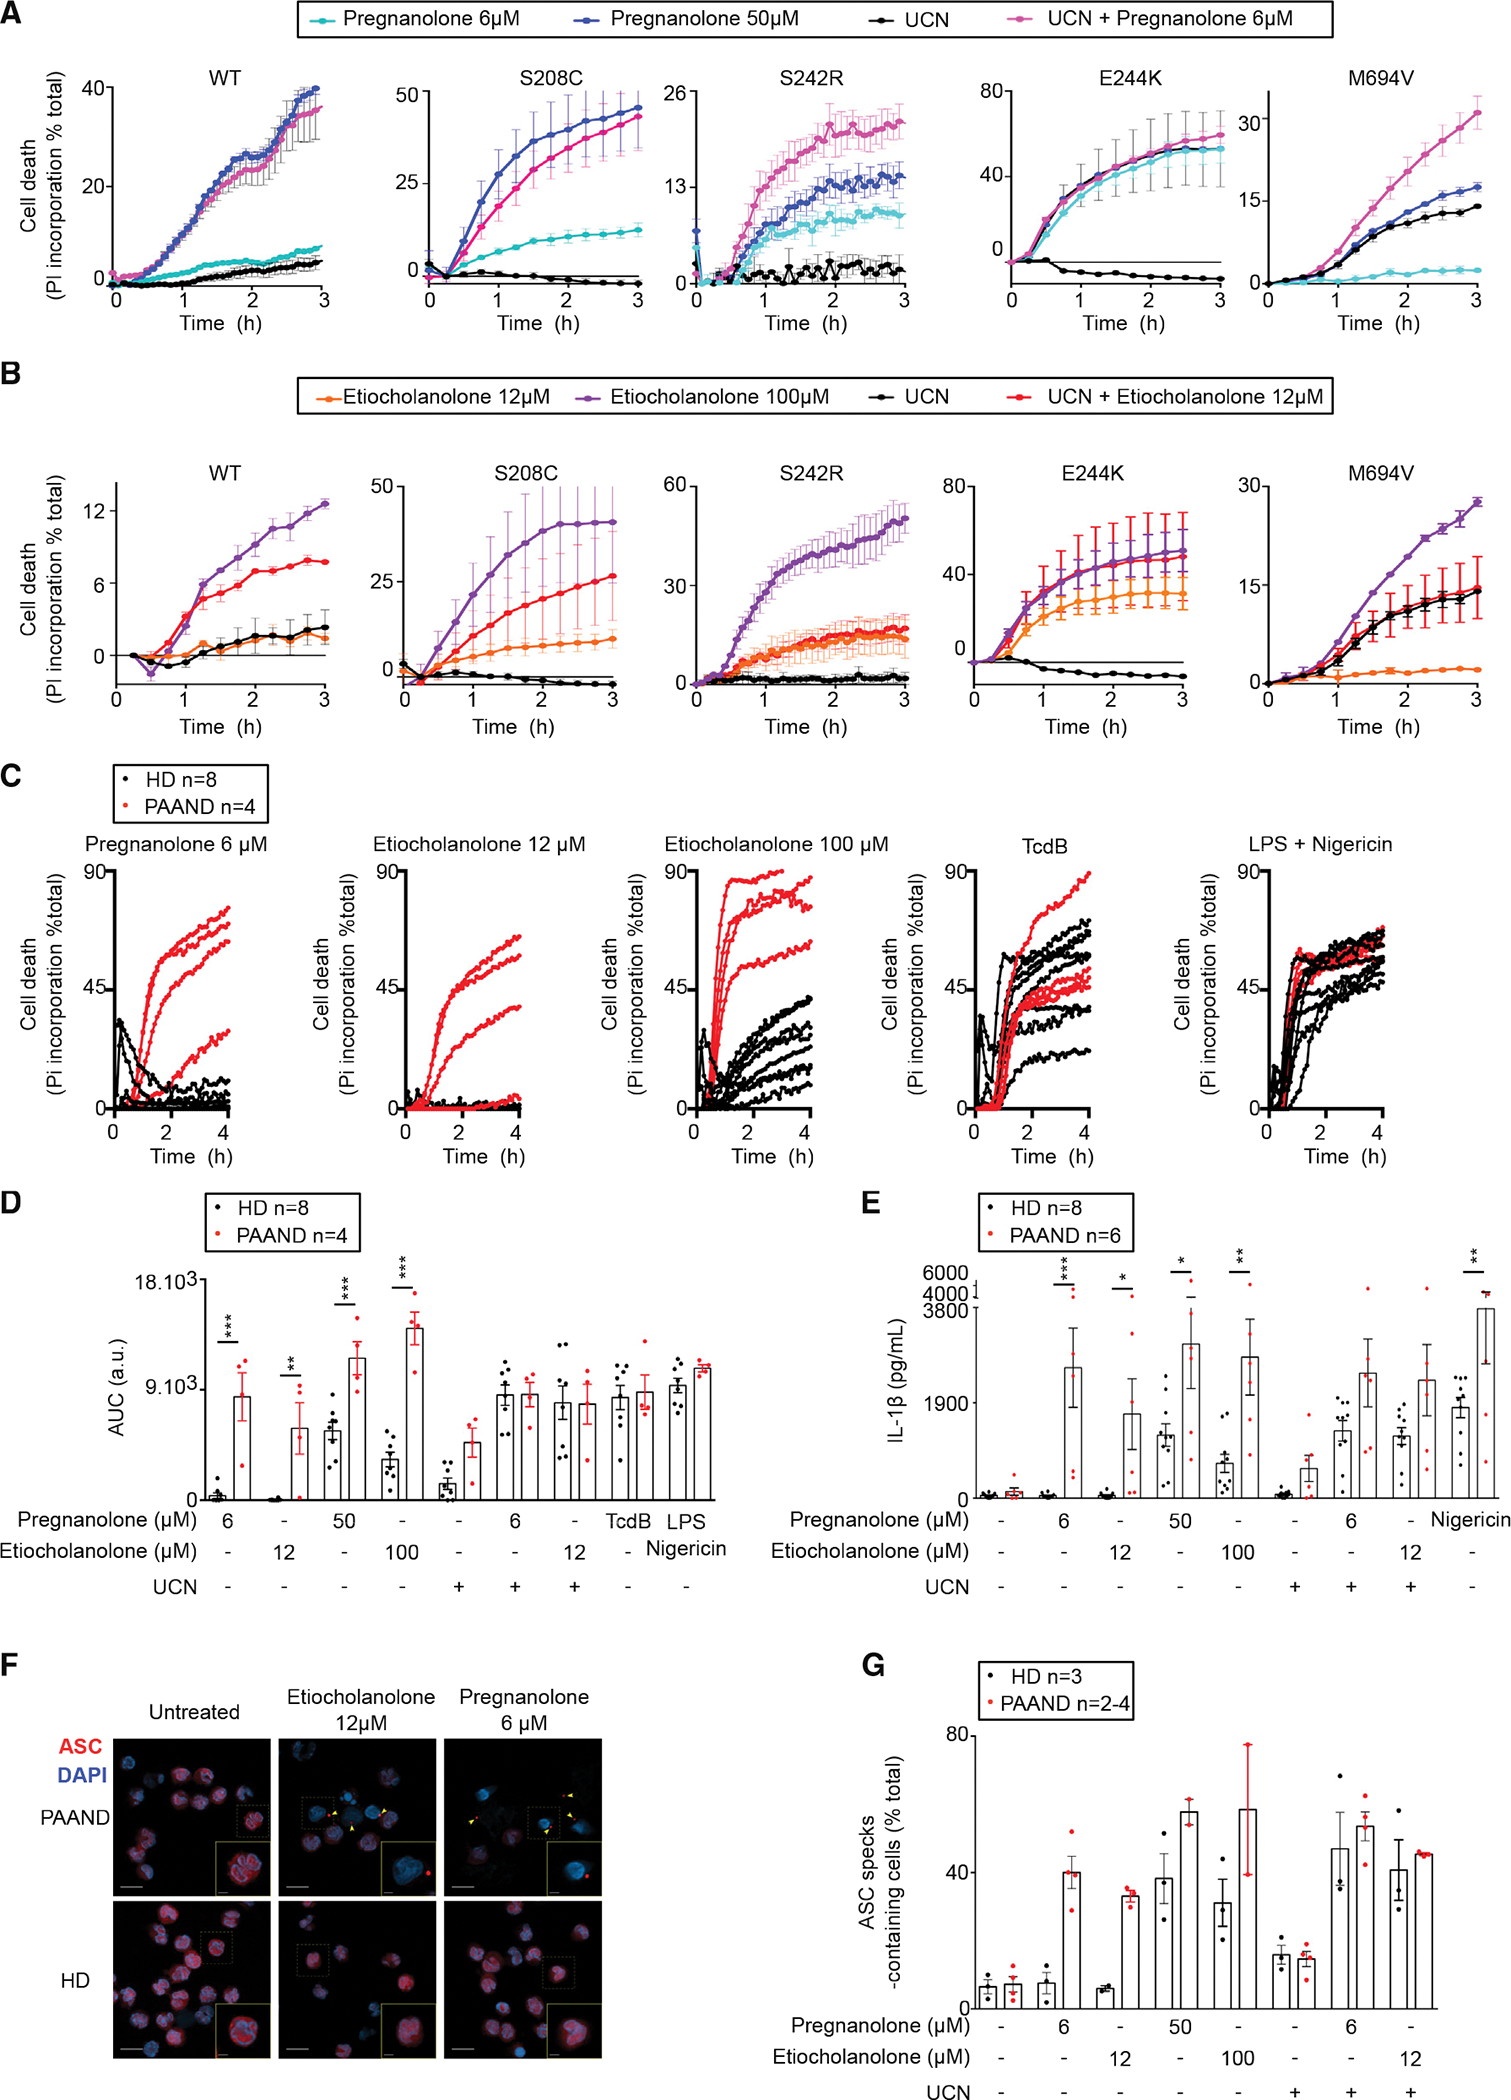
Figure 7. PAAND mutations confer hyper-responsiveness to steroid catabolites.

(A and B) U937 cell lines expressing WT or the indicated PAAND MEFV variant were treated with the indicated stimuli. Propidium iodide (PI) incorporation was monitored every 15 min for 3 h.
(C–G) Monocytes from PAAND patient(s) (red, n = 4–6) or HDs (black, n = 8) were treated with the indicated stimuli.
(C) PI incorporation was monitored every 15 min for 4 h.
(D) The corresponding area under the curve (AUC)s are shown.
(E) IL-1β concentrations were determined in the cell supernatant after 3 h of LPS treatment followed by 1.5 h of the indicated treatment.
(F and G) ASC speck formation (indicated by yellow arrows) was monitored by immunofluorescence at 90 min post-treatment.
(F) Representative images are shown. Scale bars, 10 μM (main pictures) and 2.5 μM (insets).
(G) Quantification is shown.
(A and B) One experiment representative of three independent experiments is shown. (A and B) Mean and SEM or (C) mean of triplicates are shown. (D and E) Each dot represents the mean of a triplicate for one individual. The bar represents the mean ± SEM. One way ANOVA with Sidak’s correction for multiple test was performed. (D) **p = 0.0011, ***p < 0.001; a.u., arbitrary units. (E) Etio 12 μM *p = 0.043; Pregna 50 μM *p = 0.016; Etio 100 μM **p = 0.0026; LPS Nig **p = 0.0064, ***p = 0.0001. (G) Kruskal-Wallis test with Dunn’s multiple comparison was performed. Each dot corresponds to the percentage of ASC specks based on more than 100 cells counted per condition. Each dot represents the value for one individual. The bar represents the mean ± SEM.
