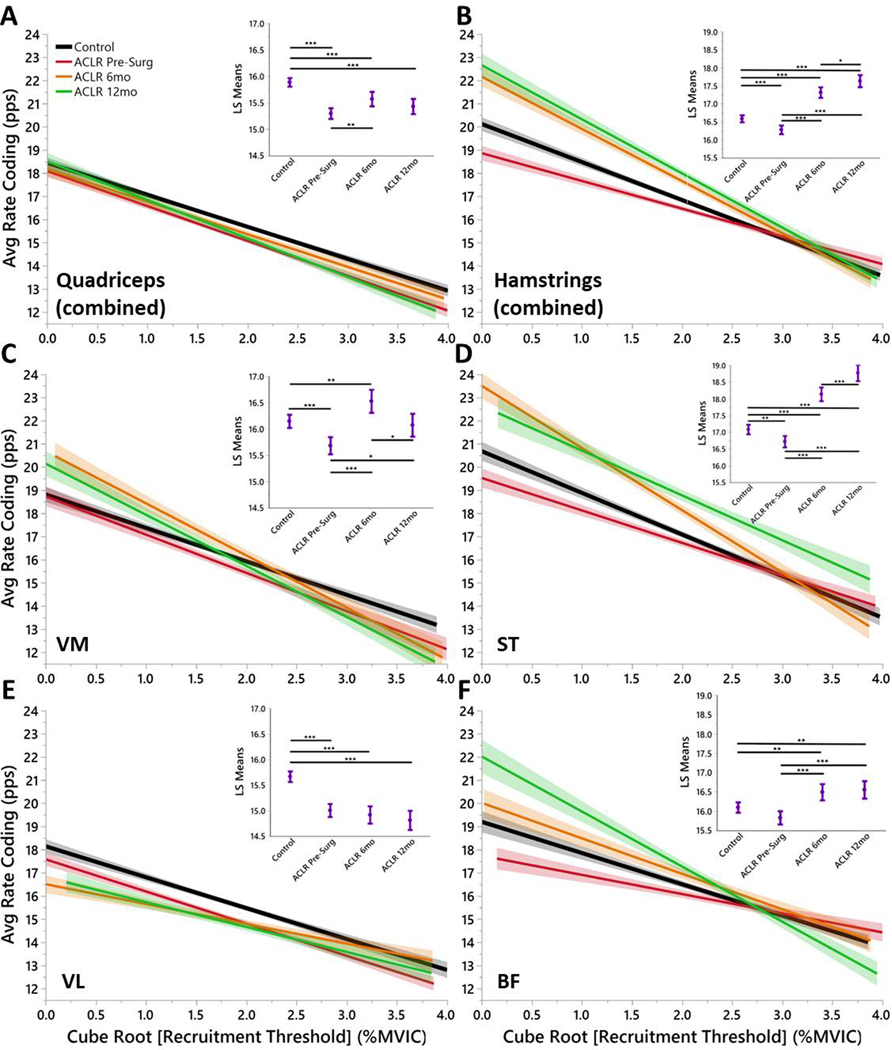
Figure 1. Quadriceps and Hamstrings Average Rate Coding by Recruitment Threshold Separated by Group.
Once a motor unit is recruited, the average firing rate represents the overall performance of the motor unit. Insets) Least Squares Means ANOVA demonstrates significant differences of average rate coding between Groups. (* denotes p<0.05; ** denotes p<0.01; *** denotes p<0.001; line shading and error bars denote 95% confidence intervals of the mean.)

