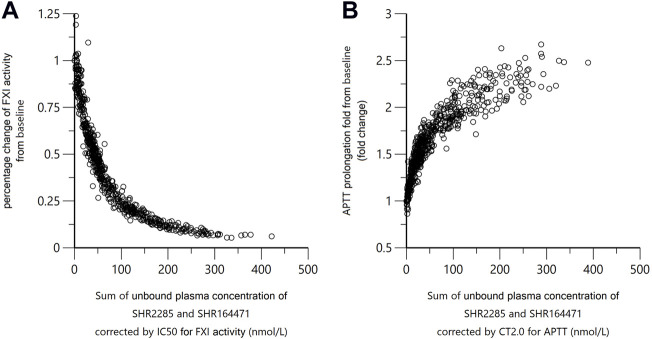
FIGURE 7.
Correlation of SHR2285/SHR164471 unbound plasma concentrations with inhibition of FXI activity and APTT prolongation. In panel (A), the x-axis indicates sum of unbounded plasma concentration of SHR2285 and SHR164471*IC50 of SHR2285 on FXI activity/IC50 of SHR164471 on FXI activity. In panel (B), the x-axis represents the sum of unbounded plasma concentration of SHR2285 and SHR164471*CT2.0 of SHR2285 on APTT/CT2.0 of SHR164471 on APTT. The plasma-protein binding rate was measured using rapid equilibrium dialysis. Unbound plasma concentration = total plasma concentration*(1–protein binding%).

