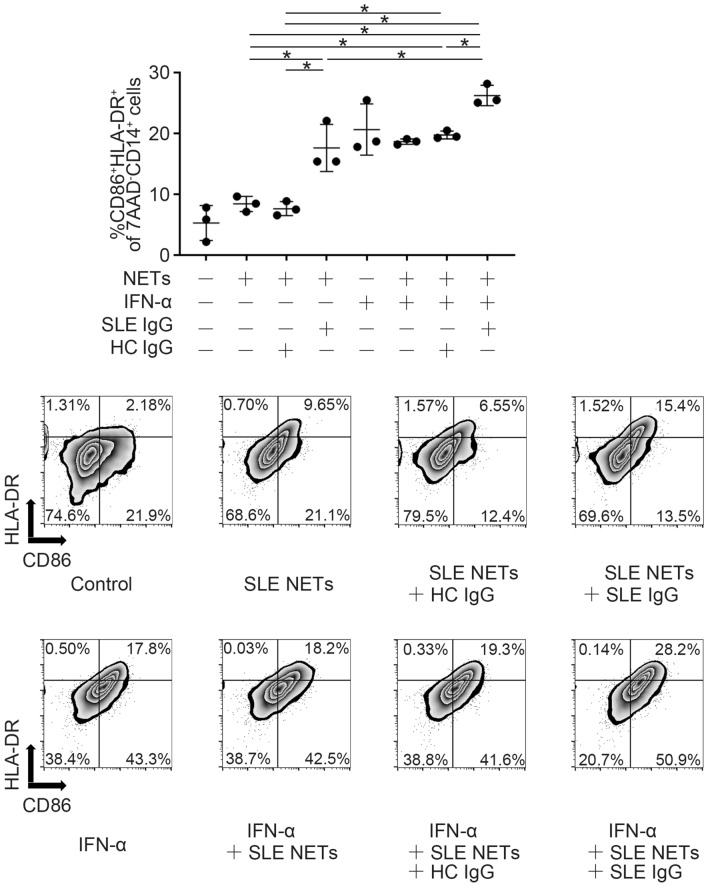
Figure 5.
Monocyte stimulation with immune complexes. (Top) Monocytes were seeded at 1 × 10⁶ cells/mL and stimulated with 300 ng/mL of SLE patient–derived NETs or with an immune complex (SLE NETs-SLE IgG [10 µg/mL] or SLE NETs-HC IgG [10 µg/mL]), with or without IFN-α, for 2 days. Monocyte activation was evaluated by the proportion of activated monocytes (7AAD-CD14+CD86+HLA-DR+) using a flow cytometer. n = 3 for each stimulation condition. (Bottom) Representative figures of flow cytometric analysis from the conditions on the top. *P < 0.05; one-way ANOVA with Tukey’s multiple comparisons test. Error bars represent mean ± SD (Control, NETs, NETs + HC/SLE IgG, and IFN-α + NETs + HC/SLE IgG were used for multiple comparisons, and error bars were not shown for the result of the comparison between control and each condition.). HC: healthy control; IFN-α: interferon alpha; IgG: immunoglobulin G; NETs: neutrophil extracellular traps; SLE: systemic lupus erythematosus.

