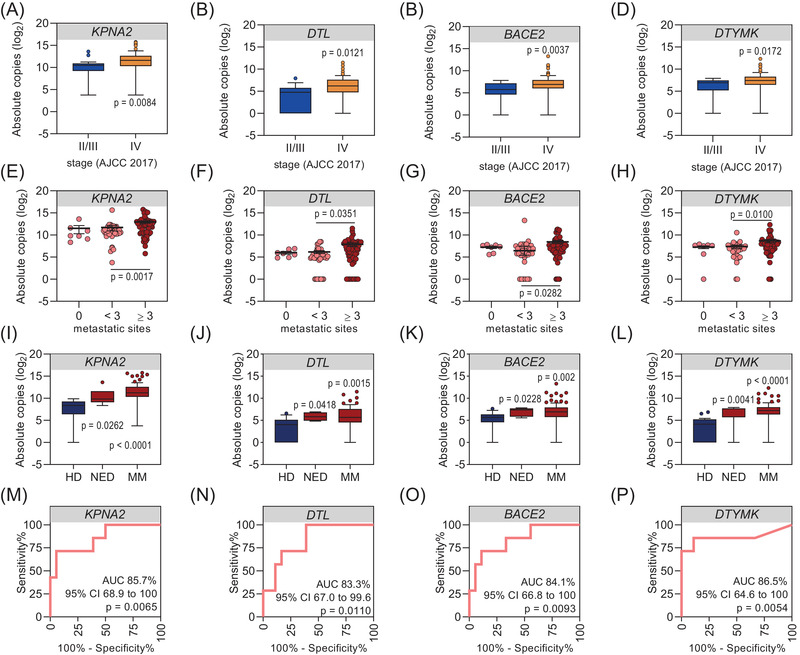
FIGURE 4.

Baseline cell‐free RNA (cfRNA) copies proportionally increase with increasing tumour stage and burden and indicate the diagnostic potential for patients with no radiological evidence of disease. (A–D) Box and whisker plots showing the distribution of cfRNA levels in plasma samples of melanoma patients as classified by AJCC stage (stage II N = 1; stage III N = 16; stage IV N = 83). Absolute cfRNA copies of (A) KPNA2, (B) DTL, (C) BACE2, (D) DTYMK. Significance was tested by Mann–Whitney U test. (E–H) Scatter dot plots showing the distribution of cfRNA levels in plasma samples of melanoma patients classified according to the number of melanoma affected organs/sites (0 metastatic sites N = 7, <3 metastatic sites N = 37, ≥3 metastatic sites N = 56). Absolute cfRNA copies (E) KPNA2, (F) DTL, (G) BACE2, (H) DTYMK. Significance was tested by the Kruskal–Wallis test with Dunn's correction for multiple comparisons. Scatter dot plots show the mean ± SEM. (I–L) Box and whisker plots showing detectable cfRNA levels in plasma samples of melanoma patients grouped according to metastatic disease (MM, N = 93) and no evidence of disease (NED, N = 7) versus healthy donors (HD, N = 18). Absolute cfRNA copies of (I) KPNA2, (J) DTL, (K) BACE2, (L) DTYMK. Significance was tested by the Kruskal–Wallis test with Dunn's correction for multiple comparisons. Box and whisker plots represent median values and interquartile ranges. (M–P) Corresponding receiver operating characteristic (ROC) analysis showing HD versus NED from (I–L).
