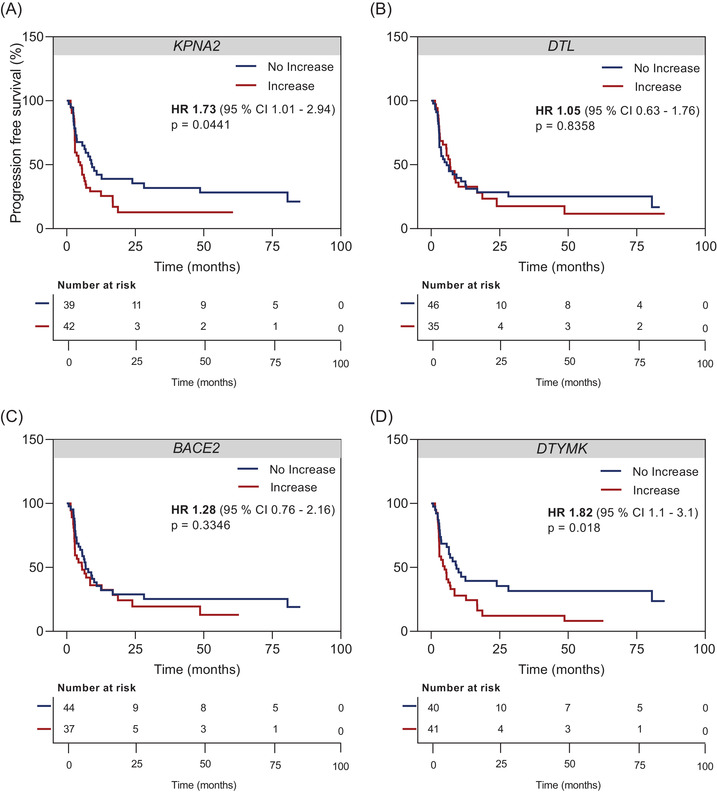
FIGURE 8.

Prognostic value of cell‐free RNA (cfRNA) changes during therapy on progression‐free survival (PFS). Kaplan–Meier plots of radiologic PFS of melanoma patients (N = 81) according to cfRNA dynamics of (A) KPNA2, (B) DTL, (C) BACE2, (D) DTYMK during therapy. Categorization into ‘no increase’ versus ‘increase’ was based on changes of absolute copy numbers in relation to the baseline. The hazard ratio is indicated for cfRNA ‘increase’. The p values were determined by the log‐rank test.
