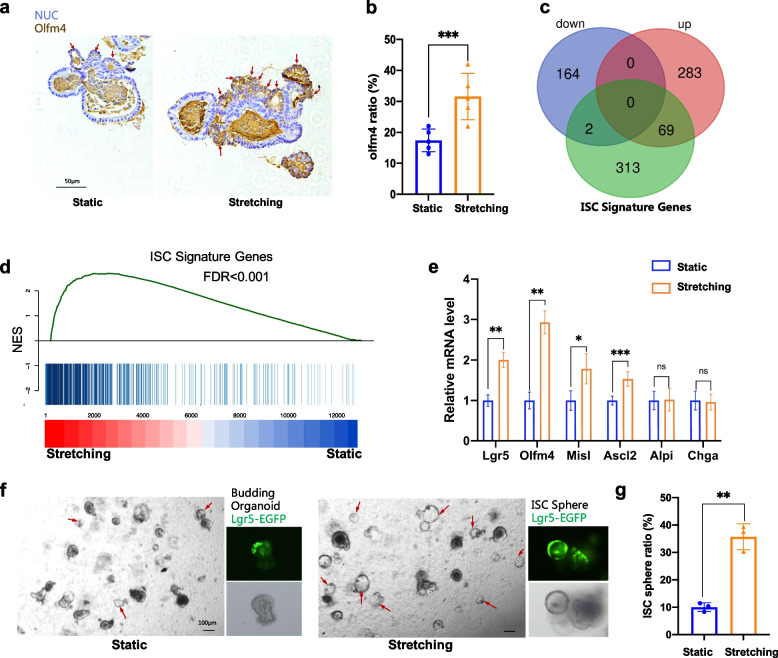
Fig. 5.
Stretching induced stemness promotion. a and b showed the imaging and quantification of IHC staining for Olfm4. c Venn diagram showing the overlap among ISC signature genes (green), up-regulated genes (red), and down-regulated genes (purple). The significance was evaluated by Fisher’s exact test. d GSEA plot of static and stretching treated organoid sample compared with a gene list containing the top 384 ISC signature genes. NES, normalized enrichment score. e Quantification of the expression level of Lgr5, Ascl2, Olfm4, Msi1, Alpi, and Chga using qRT-PCR. f Images of organoids expressing Lgr5-eGFP at day1 post passaging. The right images were for stretching and the left for static. Red arrows marked out the round transparent ISC sphere complexes. g Quantification of ISC sphere ratio. Student’s t-test: ***P < 0.001. **P < 0.01. *P < 0.05. Scale bars, 50 μm in a, 100 μm in f

