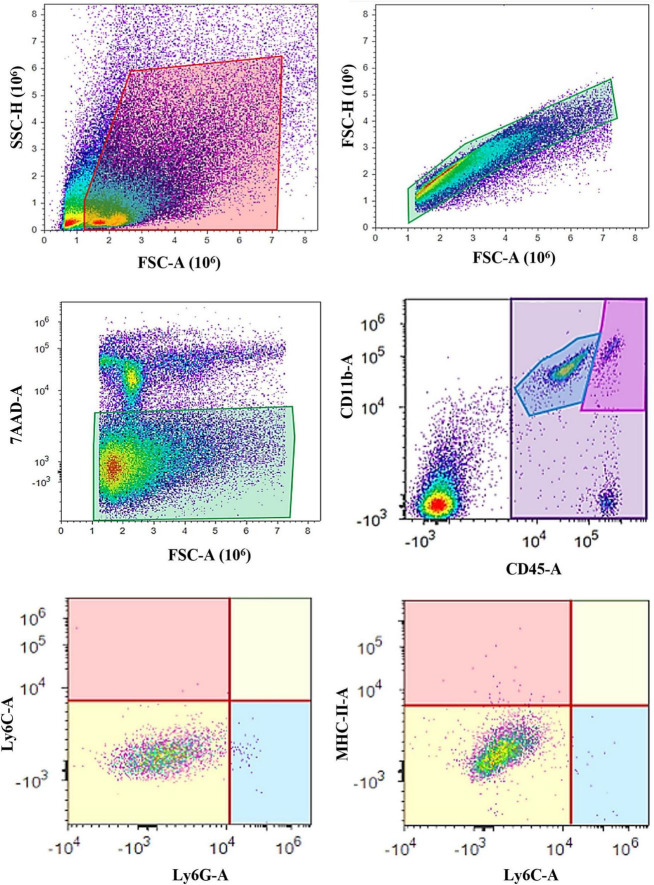
FIGURE 1.
Gating strategy for microglia analysis using flow cytometry. The cells were first sorted based on their forward (FSC) and side (SSC) scatter, followed by the single-cell gate (FSC-A and FSC-H) and live cells separation (7-AAD–). Next, the resting microglia were defined as the CD11b+CD45int cell population, while the CD11b+CD45high cells represented activated microglia and macrophages. Both the CD11b+CD45int and CD11b+CD45high populations were further assessed for Ly6C and Ly6G surface markers. MHC-II expression was additionally evaluated on the Ly6C–Ly6G– cell populations.

