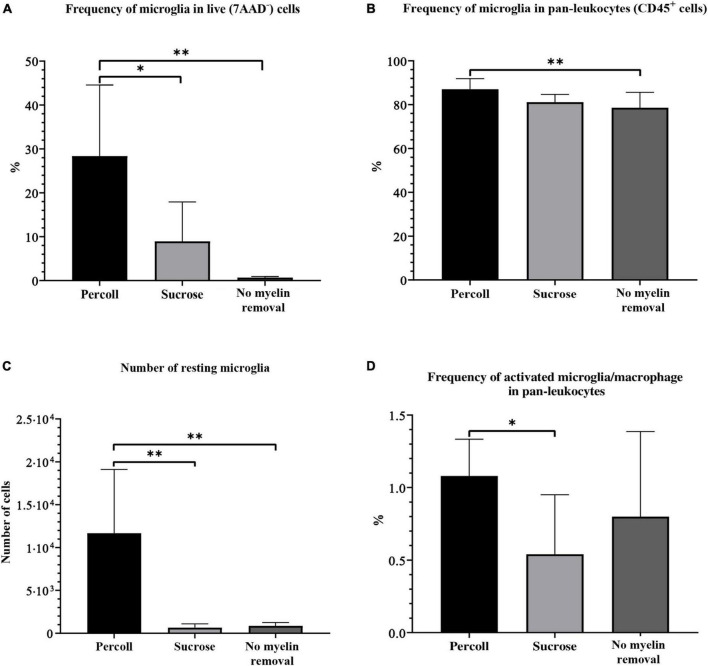
FIGURE 6.
The percentage of resting microglia in the live-cell population (A), pan-leukocyte population (B), absolute number of resting microglia (C), and percentage of activated microglia and macrophages (D) on flow cytometry obtained by different myelin removal methods. *P < 0.05; **P < 0.01. N (mice per group) = 8.

