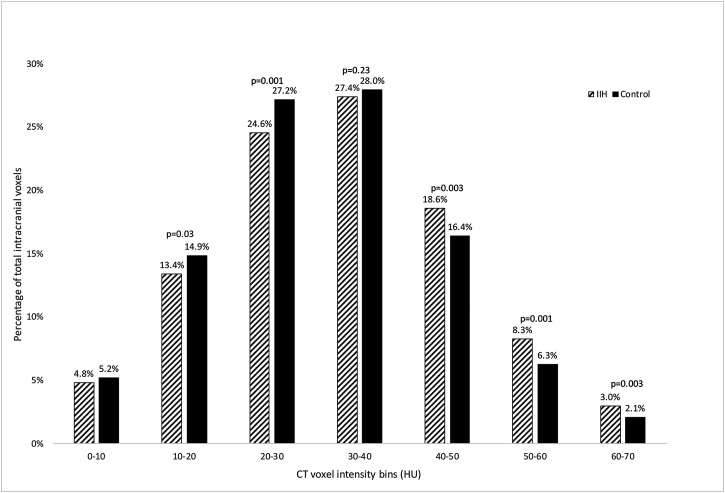
Figure 2.
Total intracranial voxel histogram distributions for IIH patients and controls. Bars represent the proportion of the total intracranial voxels that fall within the bin range of HU for the IIH group (n = 14; diagonal lines) and control group (n = 31; solid). Significantly higher proportions in the IIH group fall within the 40-50 HU, 50-60 HU, and 60-70 HU bins compared to the control group. Significantly lower proportions in the IIH group fall in the 10-20 and 20-30 HU bins compared to the control group. The 0-10 HU and 30-40 HU bins have similar proportions in both groups.

