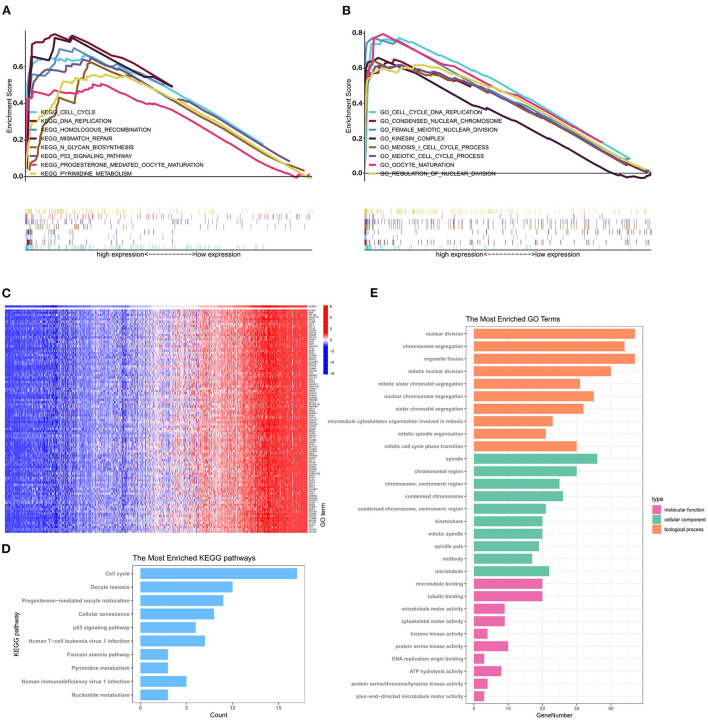
Figure 6.
GSEA, GO analysis, and KEGG enrichment analysis reveal the potential mechanism by which CENPA promotes glioma progression using the CGGA database (LGG+GBM). The top 8 gene ontologies (A) and KEGG pathways (B) based on the normalized enrichment score (NES) between the high- and low-CENPA expression phenotypes. (C) Pearson correlation coefficient heatmap of the top 100 genes positively related to CENPA. The top 10 KEGG pathways (D) and biological processes, cellular components, and molecular functions (E) of the top 100 genes co-expressed with CENPA in gliomas.

