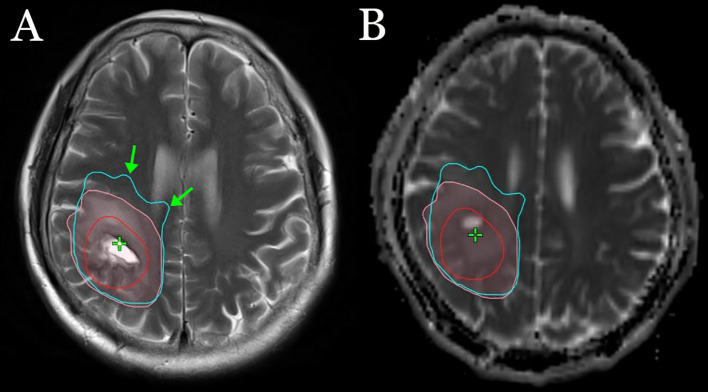
Figure 2.
An example of the sites of tumor infiltration shown by T2 (A) and the DTI-p map (B). The red line represents GTV, the pink lines represent the sites of tumor infiltration shown by T2, and the light blue lines represent the sites of tumor infiltration shown by the DTI-p map. The green arrow represents the depth of tumor infiltration shown by the DTI-p map was deeper than T2/FLAIR in the direction of adjacent main nerve fiber bundles.

