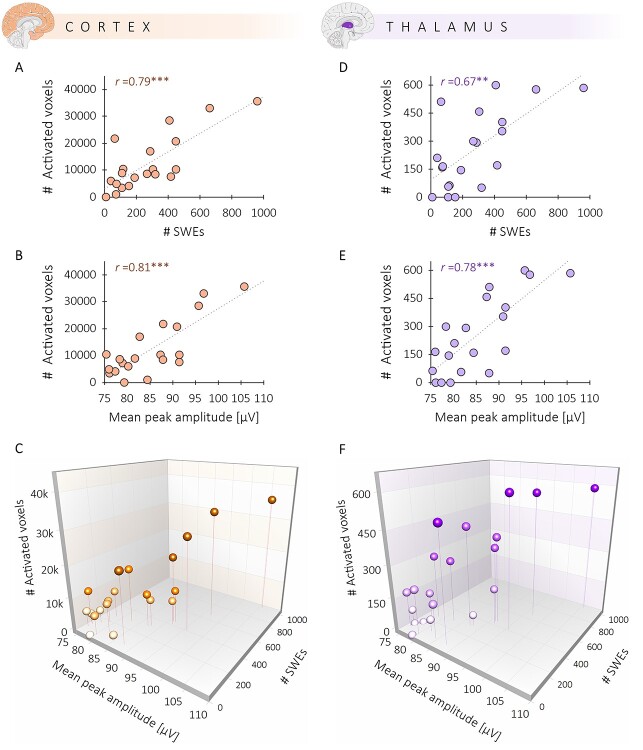
Figure 5.
Correlation between SWEs and BOLD is present in two regions critical for SWE initiation and recruitment. (A) Correlation between the number of activated voxels within the cortex and the number SWEs. (B) Relation between the number of activated cortical voxels and the mean peak amplitude of SWEs. (C) A 3D scatter plot illustrates both correlations for cortical activation. (D) Correlation between the number of activated voxels within the thalamus and the number of SWEs. (E) Relation between the number of activated thalamic voxels and the amplitude of SWEs. (F) Both correlations for thalamic activation displayed in a 3D scatter plot. ***The correlations are significant at P < 0.001. **The correlation is significant at P < 0.01.

