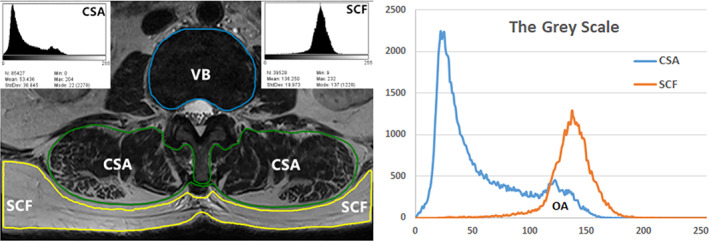
FIG. 1.

The cross‐sectional area (CSA) of the paraspinal muscle and vertebral body size (VB) were separately outlined. The fatty degeneration ratio (FDR) of the paraspinal muscle was calculated using the ImageJ, and the gray‐scale ranges for CSA and subcutaneous fat (SCF) were presented as histograms, then the overlapping area (OA) of CSA and SCF grayscale ranges were produce, which indicated the amount of fatty degeneration within the CSA. FDR was formulated by the number of pixels in the overlap area divided by the total number of pixels in the CSA
