. 2022 Oct 17;82(21):3888–3902. doi: 10.1158/0008-5472.CAN-22-1123

Figure 2.

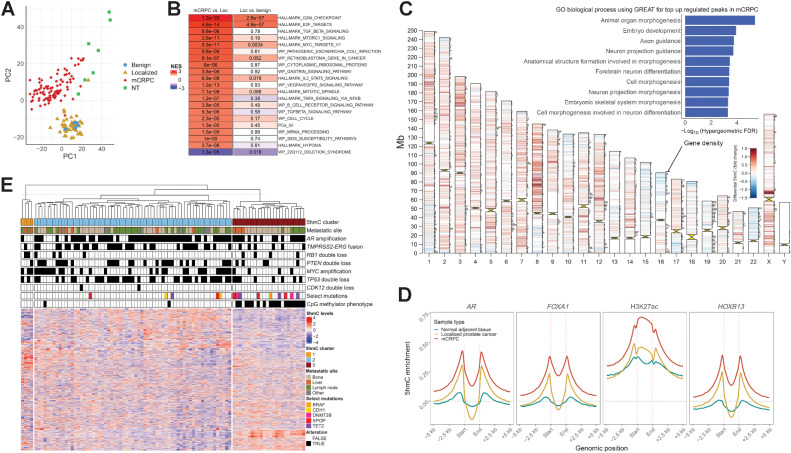
Figure 2. 5hmC patterns change at different states and subgroups of prostate cancer. A, Unsupervised visualization of global 5hmC patterns for different prostate cancer states using principal component analysis for gene body counts of the top 10% variable protein coding genes. Benign; benign prostate tissue, Localized; localized prostate cancer, mCRPC; metastatic castration-reisistant prostate cancer, NT; normal adjacent tissue (to mCRPC biopsy). B, Differential 5hmC gene body analysis between mCRCP (N = 93) and localized prostate cancer (N = 52), and localized prostate cancer and benign prostate (N = 5), respectively. Genes were ranked by the DESeq2 statistic and further analyzed by GSEA. Color represents the normalized enrichment score (NES) and adjusted p-values are shown for each pathway and state transition. Top significant pathways are shown. C, Differential 5hmC analysis for consensus peaks between localized prostate cancer and mCRPC. 5hmC peaks called by MACS2 for each sample were unified to a consensus set of peaks and used for differential analysis. Peaks with significant differences (FDR < 0.00001) are visualized per chromosome; red indicates upregulation in mCRPC and blue represents downregulation in mCRPC. Horizontal bars on chromosomes represent protein coding gene density. The most significant upregulated peaks (FDR < 0.001 and fold change > 1.5) in mCRPC were further analyzed by the GREAT tool for gene ontology biological processes, and the top 10 enriched biological processes by the hypergeometric test are shown as an insert (44). D, 5hmC enrichment at AR, FOXA1, HOXB13 and H3K27ac sites previously reported in mCRPC xenografts (21). 5hmC enrichment was calculated per sample and then averaged for localized prostate cancer (N = 52), normal adjacent tissue to mCRPC biopsies (N = 7), and mCRPC tissue samples (N = 93). E, Unsupervised hierarchical clustering of mCRPC tissue samples using 5hmC gene body counts of the top 10% most variable protein coding genes. Other means other metastatic soft tissue site. CMP; CpG methylator phenotype, NES; normalized enrichment score, Loc; Localized prostate cancer.

5hmC patterns change at different states and subgroups of prostate cancer. A, Unsupervised visualization of global 5hmC patterns for different prostate cancer states using principal component analysis for gene body counts of the top 10% variable protein coding genes. Benign, benign prostate tissue; Localized, localized prostate cancer; NT, normal adjacent tissue (to mCRPC biopsy). B, Differential 5hmC gene body analysis between mCRCP (N = 93) and localized prostate cancer (N = 52), and localized prostate cancer and benign prostate (N = 5), respectively. Genes were ranked by the DESeq2 statistic and further analyzed by GSEA. Color represents the normalized enrichment score (NES) and adjusted P values are shown for each pathway and state transition. Top significant pathways are shown. C, Differential 5hmC analysis for consensus peaks between localized prostate cancer and mCRPC. 5hmC peaks called by MACS2 for each sample were unified to a consensus set of peaks and used for differential analysis. Peaks with significant differences (FDR < 0.00001) are visualized per chromosome. Red, upregulation in mCRPC; blue, downregulation in mCRPC. Horizontal bars on chromosomes represent protein coding gene density. The most significant upregulated peaks (FDR < 0.001 and fold change > 1.5) in mCRPC were further analyzed by the GREAT tool for gene ontology biological processes, and the top 10 enriched biological processes by the hypergeometric test are shown as an inset (44). D, 5hmC enrichment at AR, FOXA1, HOXB13, and H3K27ac sites previously reported in mCRPC xenografts (21). 5hmC enrichment was calculated per sample and then averaged for localized prostate cancer (N = 52), normal adjacent tissue to mCRPC biopsies (N = 7), and mCRPC tissue samples (N = 93). E, Unsupervised hierarchical clustering of mCRPC tissue samples using 5hmC gene body counts of the top 10% most variable protein coding genes. Other, other metastatic soft tissue site. CMP, CpG methylator phenotype; Loc, localized prostate cancer.