. 2022 Oct 23;82(21):3962–3973. doi: 10.1158/0008-5472.CAN-21-4339

Figure 1.

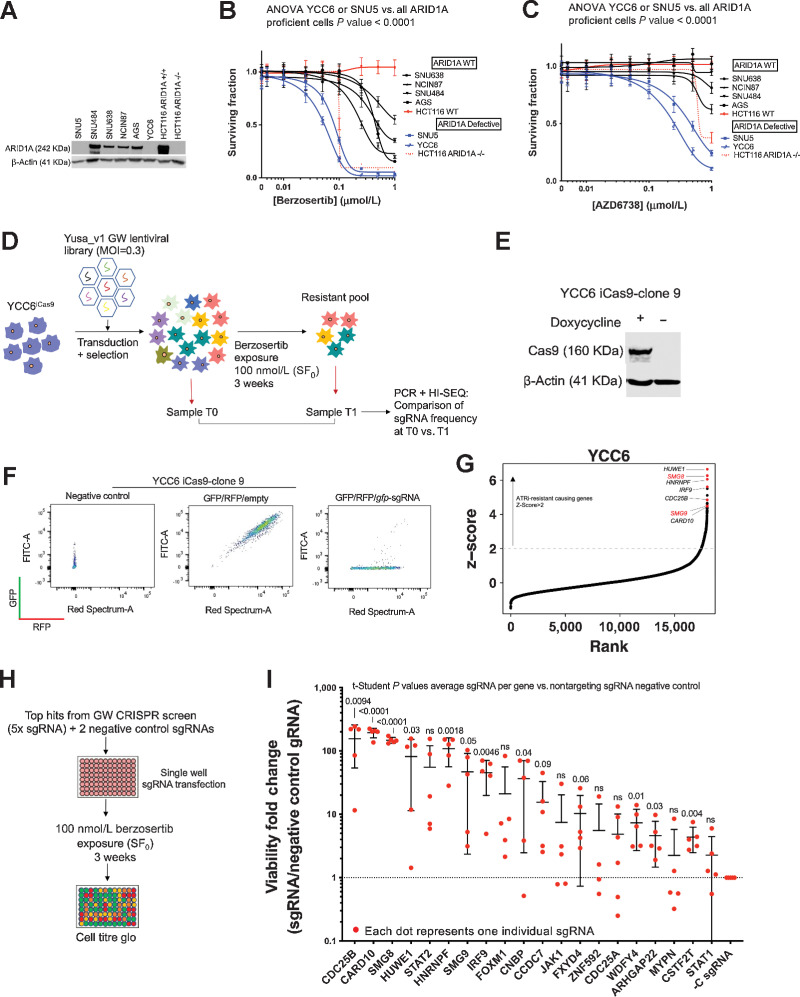
Figure 1. Gastric cancer genome-wide CRISPRn screen identifies genetic determinants of ATRi resistance. A, YCC6 and SNU5 gastric tumor cell lines show no ARID1A expression by Western blotting. Other ARID1A-proficient gastric tumor cell lines are represented in this Western blot analysis and HCT116 ARID1A isogenic cell lines are used as positive and negative controls. B and C, Dose–response survival curves (384-well plate, 5-day assay) show that YCC6 and SNU5 (blue) are sensitive to ATRi, compared with the ARID1A-proficient gastric cancer cell lines (black). HCT116 isogenic controls are highlighted in red. D, Schematic illustrating a genome-wide ATRi CRISPR/Cas9 screen using the YCC6 gastric cancer cell line. E, Western blot analysis showing that YCC6 gastric tumor cell line (clone 9) expresses Cas9 upon doxycycline induction after being transduced with an Edit-R Inducible Lentiviral hEF1a-Blast-Cas9 Nuclease vector and selected with blasticidin. F, YCC6 iCas9 cells have a catalytically active Cas9 as shown by flow cytometry. GFP/RFP/Empty represent iCas9 cells transduced with GFP- and RFP-expressing lentiviral constructs. GFP/RFP/gfp-sgRNA represents iCas9 cells that were additionally transduced with a sgRNA-targeting GFP that cleaves the GFP protein thereby decreasing green fluorescence emission. G, Scatter plot illustrating sgRNA z-score for ATRi-resistant cells retrieved at T1 compared with untreated cells retrieved at T0 plotted against the rank calculated from the rank product of z-score and MAGeCK analysis of sgRNA counts. The genes targeted by sgRNA that were most enriched (T1-T0) are highlighted in red at the top right corner of the graph comprising CDC25B, SMG8, SMG9, HUWE1, IRF9, HNRNPF, and CARD10. H, Diagram showing the validation screen workflow. I, Results of the deconvoluted CRISPRn validation screen in 96-well plate format. Each red dot represents an individual sgRNA. P values were calculated by conducting a t test comparing all sgRNAs per gene versus all sgRNAs per the control sgRNA. Dose–response curves, Western blot analysis and the deconvoluted CRISPRn validation screen in 96-well plate format are representative of three or more biological replicates.

Gastric cancer genome-wide CRISPRn screen identifies genetic determinants of ATRi resistance. A, YCC6 and SNU5 gastric tumor cell lines show no ARID1A expression by Western blotting. Other ARID1A-proficient gastric tumor cell lines are represented in this Western blot analysis and HCT116 ARID1A isogenic cell lines were used as positive and negative controls. B and C, Dose–response survival curves (384-well plate, 5-day assay) show that YCC6 and SNU5 (blue) are sensitive to ATRi, compared with the ARID1A-proficient gastric cancer cell lines (black). HCT116 isogenic controls are highlighted in red. D, Schematic illustrating a genome-wide ATRi CRISPR/Cas9 screen using the YCC6 gastric cancer cell line. E, Western blot analysis showing that YCC6 gastric tumor cell line (clone 9) expresses Cas9 upon doxycycline induction after being transduced with an Edit-R Inducible Lentiviral hEF1a-Blast-Cas9 Nuclease vector and selected with blasticidin. F, YCC6 iCas9 cells have a catalytically active Cas9 as shown by flow cytometry. GFP/RFP/Empty represent iCas9 cells transduced with GFP- and RFP-expressing lentiviral constructs. GFP/RFP/gfp-sgRNA represents iCas9 cells that were additionally transduced with a sgRNA-targeting GFP that cleaves the GFP protein thereby decreasing green fluorescence emission. G, Scatter plot illustrating sgRNA z-score for ATRi-resistant cells retrieved at T1 compared with untreated cells retrieved at T0 plotted against the rank calculated from the rank product of z-score and MAGeCK analysis of sgRNA counts. The genes targeted by sgRNA that were most enriched (T1-T0) are highlighted in red at the top right corner of the graph comprising CDC25B, SMG8, SMG9, HUWE1, IRF9, HNRNPF, and CARD10. H, Diagram showing the validation screen workflow. I, Results of the deconvoluted CRISPRn validation screen in 96-well plate format. Each red dot represents an individual sgRNA. P values were calculated by conducting a t test comparing all sgRNAs per gene versus all sgRNAs per the control sgRNA. Dose–response curves, Western blot analysis, and the deconvoluted CRISPRn validation screen in 96-well plate format are representative of three or more biological replicates. ns, nonsignificant.