. 2022 Oct 23;82(21):3962–3973. doi: 10.1158/0008-5472.CAN-21-4339

Figure 4.

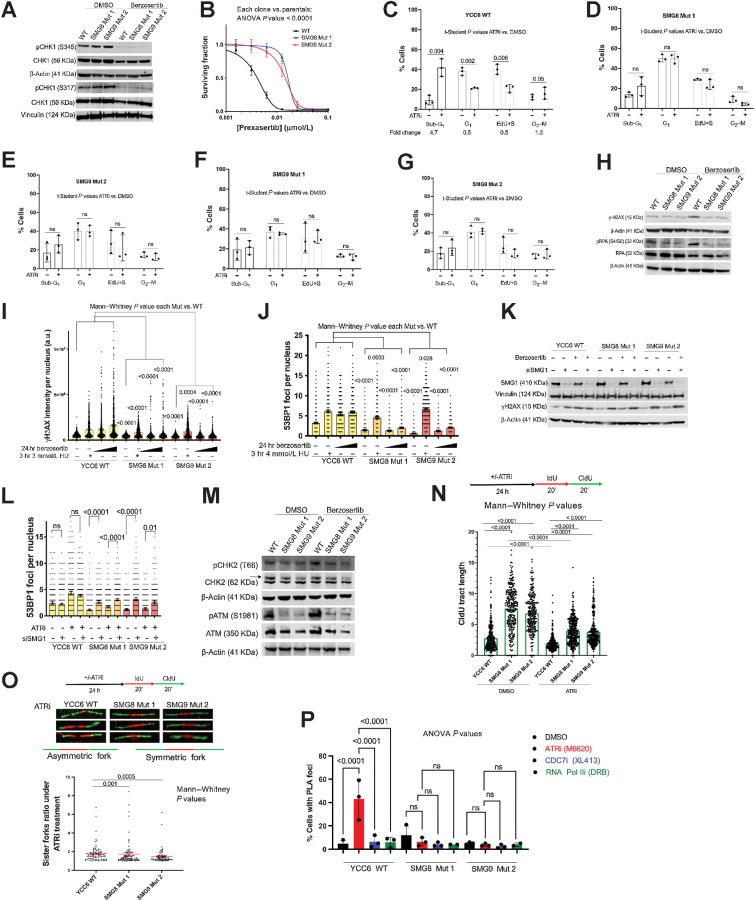
Figure 4. SMG8/9 mutation does not reverse the inhibition of ATR/CHK1 signaling but abrogates ATRi-associated cell-cycle effects, RFS, and TRCs. A, SMG8 and SMG9 mutant cells do not show increased pCHK1 (Ser317 and Ser345) or total CHK1 protein expression levels compared with the WT cells after 24 hours of DMSO or 400 nmol/L berzosertib exposure. B, SMG8 (blue) and SMG9 (red) mutant cells are resistant to the CHK1i prexasertib (384-well plate, 5-day assay), compared with the WT cells (black). C–G, Flow cytometry EdU/propidium iodide staining cell-cycle analysis showing the percentage of cells in sub-G1, G1, active S-phase (EdU+ cells) and G2–M cells in the WT cells, two SMG8 mutant and two SMG9 mutant clones after 48 hours of DMSO or 150 nmol/L ATRi exposure. H, SMG8 and SMG9 mutant cells show lower levels of γ-H2AX and pRPA (S4/S8) protein expression after 48 hours of DMSO or 150 nmol/L berzosertib exposure by Western blot analysis. I, SMG8 (orange) and SMG9 (red) mutant cells show lower levels γ-H2AX intensity compared with the WT cells (yellow) after 24 hours of DMSO or 400 or 800 nmol/L of ATRi exposure, despite showing an increase in γ-H2AX intensity after 3 hours of 3 mmol/L HU. A complete version of the representative image can be found in Supplementary Fig. S4D and S4E. J, SMG8 (orange) and SMG9 (red) mutant cells show lower levels of p53BP1 foci compared with the WT cells (yellow) after 24 hours of DMSO or 400 or 800 nmol/L of ATRi exposure, despite showing an increase in the number of 53BP1 foci after 3 hours of 3 mmol/L HU. A complete version of the representative image can be found in Supplementary Fig. S4D and S4E. K, Western blot analysis showing that SMG1 knockdown rescues levels of γ-H2AX protein expression in the SMG8 and SMG9 mutant cells after 24 hours of DMSO or 300 mmol/L berzosertib exposure in cells transfected with 1 nmol/L siSMG1 or siCON2, 72 hours before protein extraction. L, SMG1 knockdown rescues the levels of 53BP1 foci in the SMG8 and SMG9 mutant cells after 24 hours of DMSO or 400 or 800 nmol/L of berzosertib exposure after their transfection with 2 μmol/L of siSMG1 or siCON2, 72 hours before protein extraction. HU (3 hours of 3 mmol/L) is used as a positive control. M, SMG8 and SMG9 mutant cells show lower levels of pCHK2 (T68) and pATM (S1981) protein expression by Western blotting in the SMG8 Mut 1 and SMG9 Mut 2 cells after 48 hours exposure to DMSO or 150 nmol/L berzosertib, compared with the WT. N, SMG8 and SMG9 mutant cells show increased CIdU track length (a.u.) compared with WT cells in a DNA fibre assay after 24 hours of 300 nmol/L berzosertib or DMSO exposure (20 minutes incubation with 25μmol/L IdU and 20 minutes incubation with 125 μmol/L CIdU). O, SMG8 and SMG9 mutant cells present decreased forks ratio (a.u.) compared with the WT cells in a DNA fibre assay after 24 hours of 300 nmol/L berzosertib exposure (20 minutes incubation with 25 μmol/L IdU and 20 minutes incubation with 125 μmol/L CIdU). P, SMG8 and SMG9 mutant cells present lower levels of RNAPolII/PCNA PLA foci (measuring TRCs) per cell after 24 hours of 300 nmol/L ATRi, DMSO or 2 hours of 80 μmol/L of the RNAPII inhibitor DRB exposure. P values were calculated using a one-way ANOVA test). All images are representative of three or more biological replicates.

SMG8/9 mutation does not reverse the inhibition of ATR/CHK1 signaling but abrogates ATRi-associated cell-cycle effects, RFS, and TRCs. A, SMG8 and SMG9 mutant cells do not show increased pCHK1 (Ser317 and Ser345) or total CHK1 protein expression levels compared with the WT cells after 24 hours of DMSO or 400 nmol/L berzosertib exposure. B, SMG8 (blue) and SMG9 (red) mutant cells are resistant to the CHK1i prexasertib (384-well plate, 5-day assay) compared with the WT cells (black). C–G, Flow cytometry EdU/propidium iodide staining cell-cycle analysis showing the percentage of cells in sub-G1, G1, active S-phase (EdU+ cells), and G2–M cells in the WT cells, two SMG8 mutant and two SMG9 mutant clones after 48 hours of DMSO or 150 nmol/L ATRi exposure. H, SMG8 and SMG9 mutant cells show lower levels of γH2AX and pRPA (S4/S8) protein expression after 48 hours of DMSO or 150 nmol/L berzosertib exposure by Western blot analysis. I, SMG8 (orange) and SMG9 (red) mutant cells show lower levels of γH2AX intensity compared with the WT cells (yellow) after 24 hours of DMSO or 400 or 800 nmol/L of ATRi exposure, despite showing an increase in γH2AX intensity after 3 hours of 3 mmol/L HU. A complete version of the representative image can be found in Supplementary Fig. S4D and S4E. J, SMG8 (orange) and SMG9 (red) mutant cells show lower levels of p53BP1 foci compared with the WT cells (yellow) after 24 hours of DMSO or 400 or 800 nmol/L of ATRi exposure, despite showing an increase in the number of 53BP1 foci after 3 hours of 3 mmol/L HU. A complete version of the representative image can be found in Supplementary Fig. S4D and S4E. K, Western blot analysis showing that SMG1 knockdown rescues levels of γH2AX protein expression in the SMG8 and SMG9 mutant cells after 24 hours of DMSO or 300 mmol/L berzosertib exposure in cells transfected with 1 nmol/L siSMG1 or siCON2, 72 hours before protein extraction. L, SMG1 knockdown rescues the levels of 53BP1 foci in the SMG8 and SMG9 mutant cells after 24 hours of DMSO or 400 or 800 nmol/L of berzosertib exposure after their transfection with 2 μmol/L of siSMG1 or siCON2, 72 hours before protein extraction. HU (3 hours of 3 mmol/L) was used as a positive control. M, SMG8 and SMG9 mutant cells show lower levels of pCHK2 (T68) and pATM (S1981) protein expression by Western blotting in the SMG8 Mut 1 and SMG9 Mut 2 cells after 48 hours exposure to DMSO or 150 nmol/L berzosertib compared with the WT. N, SMG8 and SMG9 mutant cells show increased CIdU track length (a.u.) compared with WT cells in a DNA fiber assay after 24 hours of 300 nmol/L berzosertib or DMSO exposure (20 minutes incubation with 25 μmol/L IdU and 20 minutes incubation with 125 μmol/L CIdU). O, SMG8 and SMG9 mutant cells present decreased forks ratio (a.u.) compared with the WT cells in a DNA fiber assay after 24 hours of 300 nmol/L berzosertib exposure (20 minutes incubation with 25 μmol/L IdU and 20 minutes incubation with 125 μmol/L CIdU). P, SMG8 and SMG9 mutant cells present lower levels of RNAPolII/PCNA PLA foci (measuring TRCs) per cell after 24 hours of 300 nmol/L ATRi, DMSO, or 2 hours of 80 μmol/L of the RNAPII inhibitor DRB exposure. P values were calculated using a one-way ANOVA test). All images are representative of three or more biological replicates. ns, nonsignificant.