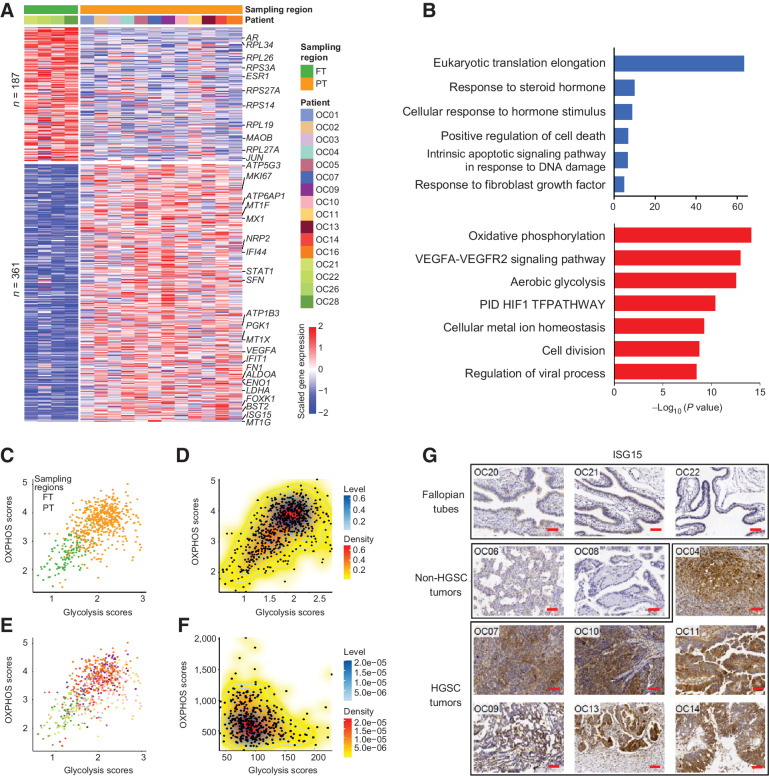
Figure 2.
Dynamic changes of RNA expression from normal FTE to primary tumors. A, Heatmap showing DEGs between normal FTE and primary tumor cells. Each row represents a DEG. The color bar at the top represents sampling regions and patient origins. B, The GO enrichment of DEGs. Red, upregulated genes in primary tumor cells; blue, downregulated genes in primary tumor cells. C and E, Scatterplots of the OXPHOS and glycolysis scores of cells in our study colored by sampling regions (C) and patients (E). The colors of patients are the same as A. D and F, 2D density plots of the OXPHOS and glycolysis scores of cells in our study (D) and patients in TCGA project (F). G, IHC determination of ISG15 expression in FTE, non-HGSC, and HGSC tumors. Scale bar, 40 μm.

