. 2022 Aug 16;82(21):3903–3916. doi: 10.1158/0008-5472.CAN-21-3819

Figure 6.

Figure 6. Dynamic changes of DNA methylation from primary tumors to metastases. A, Single-cell global DNA methylation levels of primary tumor cells and matched metastases within the same lineage. Each point represents a single cell, colored by genetic lineages. The lines at the bottom, middle, and top represent 25%ile, median, and 75%ile values, respectively. “Pri_tum” and “Met” represent primary tumor and metastasis, respectively. B, Clustering of cancer cells based on DNA methylation for OC09 and OC14, colored by genetic lineages (left) and sampling regions (right). Pri_tum, primary tumor; Met_LN, lymph node metastasis; Met_Ome, omental metastasis.

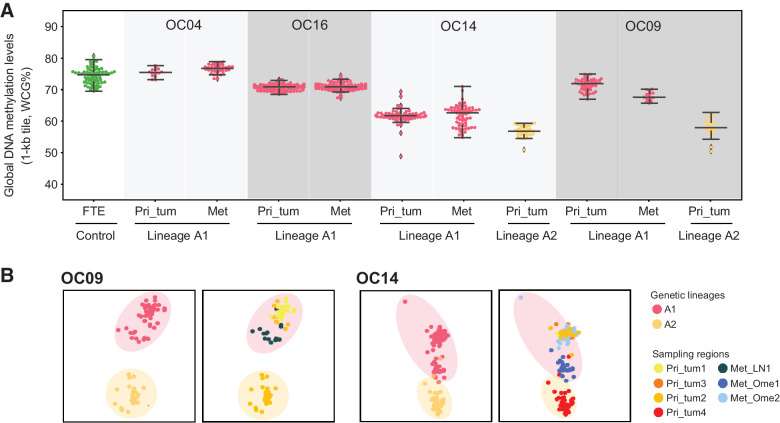
Dynamic changes of DNA methylation from primary tumors to metastases. A, Single-cell global DNA methylation levels of primary tumor cells and matched metastases within the same lineage. Each point represents a single cell, colored by genetic lineages. The lines at the bottom, middle, and top represent 25 percentile, median, and 75%ile values, respectively. “Pri_tum” and “Met” represent primary tumor and metastasis, respectively. B, Clustering of cancer cells based on DNA methylation for OC09 and OC14, colored by genetic lineages (left) and sampling regions (right). Pri_tum, primary tumor; Met_LN, lymph node metastasis; Met_Ome, omental metastasis.