. 2022 Aug 16;82(21):3903–3916. doi: 10.1158/0008-5472.CAN-21-3819

Figure 8.

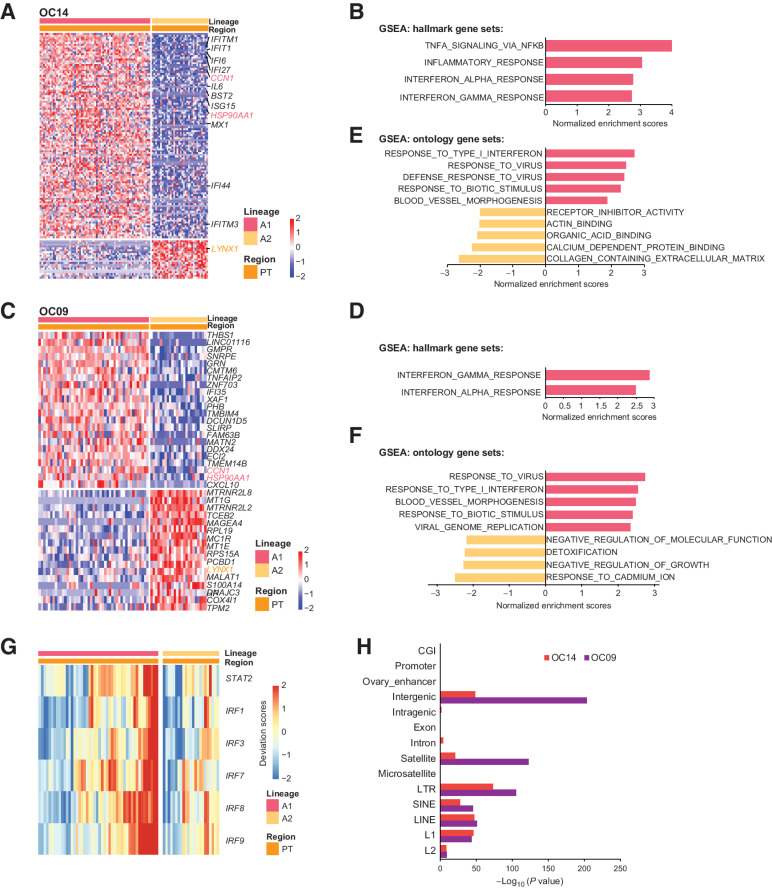
Figure 8. Intratumor heterogeneities of primary tumors reveal critical pathways involved in the metastasis. A and C, Heatmaps of DEGs between primary tumor cells of lineage A1 and lineage A2 for OC14 (A) and OC09 (C). B and D, GSEA analysis for OC14 (B) and OC09 (D) showing the enriched pathways of lineage A1 using hallmark gene sets. E and F, GSEA analysis for OC14 (E) and OC09 (F) showing the enriched pathways of lineage A1 using ontology gene sets. G, Heat map showing that the binding motifs of TFs involved in interferon responses is more open in lineage A1 than lineage A2 for OC09. H, Enrichment analysis of annotated genomic elements on hypomethylated tiles in lineage A2 compared with lineage A1.

Intratumor heterogeneities of primary tumors reveal critical pathways involved in the metastasis. A and C, Heatmaps of DEGs between primary tumor cells of lineage A1 and lineage A2 for OC14 (A) and OC09 (C). B and D, GSEA analysis for OC14 (B) and OC09 (D) showing the enriched pathways of lineage A1 using hallmark gene sets. E and F, GSEA analysis for OC14 (E) and OC09 (F) showing the enriched pathways of lineage A1 using ontology gene sets. G, Heat map showing that the binding motifs of TFs involved in interferon responses is more open in lineage A1 than lineage A2 for OC09. H, Enrichment analysis of annotated genomic elements on hypomethylated tiles in lineage A2 compared with lineage A1.