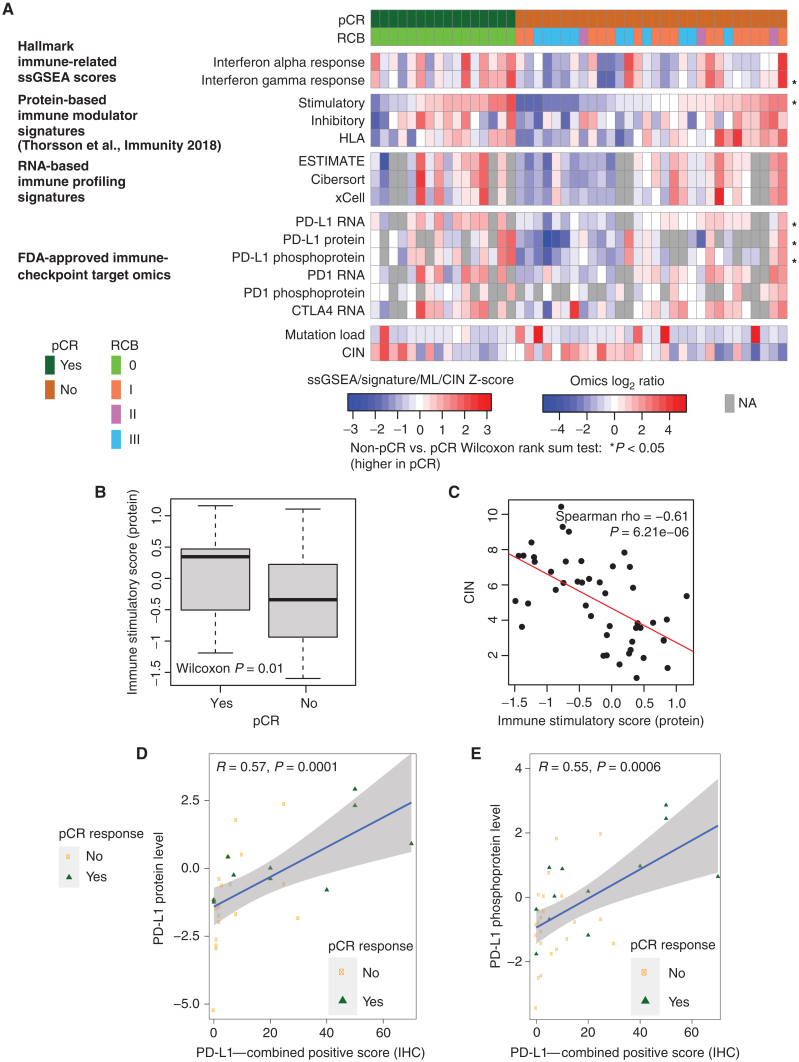
Figure 2.
Proteogenomic features associated with the immune microenvironment are elevated in pCR tumors relative to non-pCR tumors. A, Heat map shows protein-based Hallmark ssGSEA scores, protein-based immune modulator scores, RNA-based immune profiles, and proteogenomic features for immune-checkpoint genes that are targets of FDA-approved inhibitors. Within each group (pCR and non-pCR), samples are ordered by increasing immune stimulatory score. *, P < 0.05 by the Wilcoxon rank sum test comparing non-pCR with pCR tumors. NA, not available. B, The protein-based immune stimulatory score is significantly higher in pCR tumors than in non-pCR tumors (P = 0.01, Wilcoxon rank sum test). Box plots show interquartile range (IQR) with the median marked in the center. Whiskers indicate 1.5× IQR. C, The immune stimulatory score is negatively correlated to CIN (Spearman rho = −0.612, P = 6.2e−6). The scatter plot shows immune stimulatory score on the x-axis and CIN on the y-axis.D and E, Scatter plots showing the Pearson correlation between PD-L1 IHC levels with PD-L1 protein (D) and phosphoprotein levels (E). pCR cases are shown in green and non-pCR in orange.

