Figure 3.
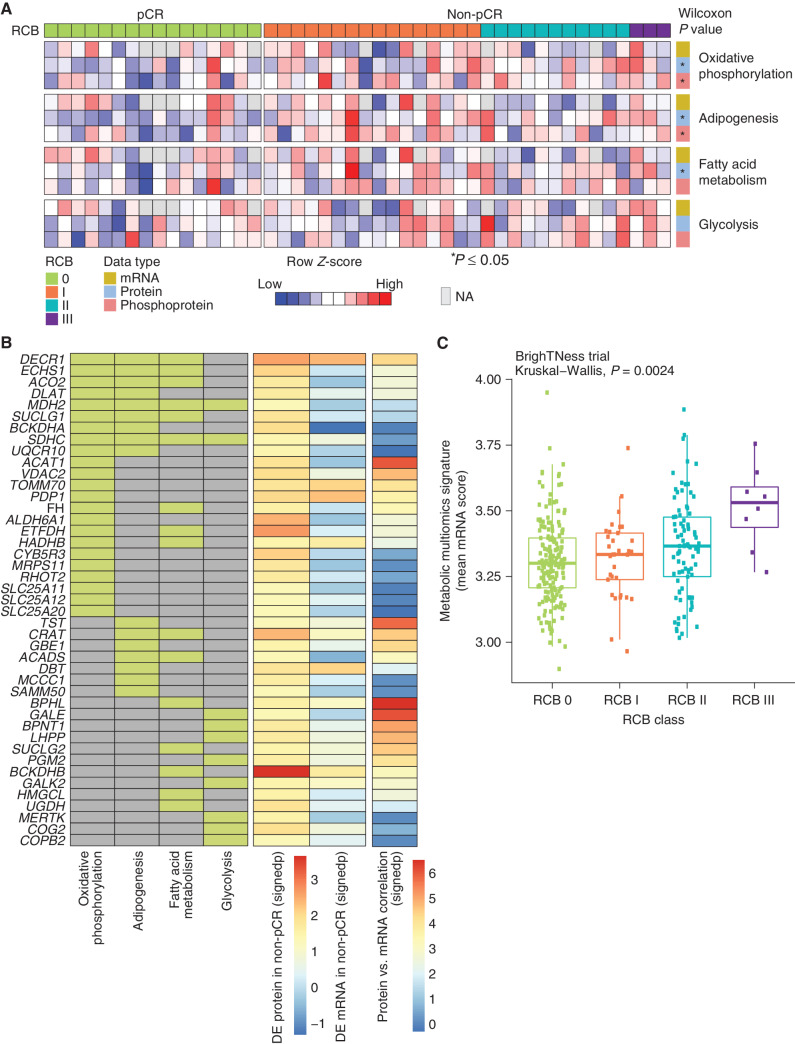
Proteogenomic features associated with the lack of pCR in TNBC tumors. A, Heat map showing ssGSEA normalized enrichment score for metabolic Hallmark pathways that are significantly higher in non-pCR cases, arranged by RCB 0 (pCR) and RCB I/II/III (non-pCR). Shown are the four pathways that showed significant enrichment at either the RNA or protein level in Fig. 1E. Single-sample pathway enrichment scores were assessed at the level of mRNA (yellow), protein (blue), and phosphoprotein (red). The Wilcoxon rank sum test was used to compare scores for non-pCR vs. pCR scores; *, P < 0.05. NA, not available. B, Membership of differentially regulated proteins to pathways highlighted in A. Proteins (rows) belonging to a given pathway (columns) are shown in light green. The differential expression (DE) at protein and mRNA levels for each gene along with mRNA–protein correlation scores are shown as signed −log10P value (signedp). C, A multiomics metabolic gene signature derived for genes that are correlated at mRNA and protein levels was further investigated in patients treated with carboplatin and paclitaxel in the BrighTNess clinical trial (treatment arms A and B) for which RNA-seq data were available. The mean mRNA expression score for this signature was significantly higher in higher RCB tumors.

