. 2022 Aug 24;12(11):2586–2605. doi: 10.1158/2159-8290.CD-22-0200

Figure 7.

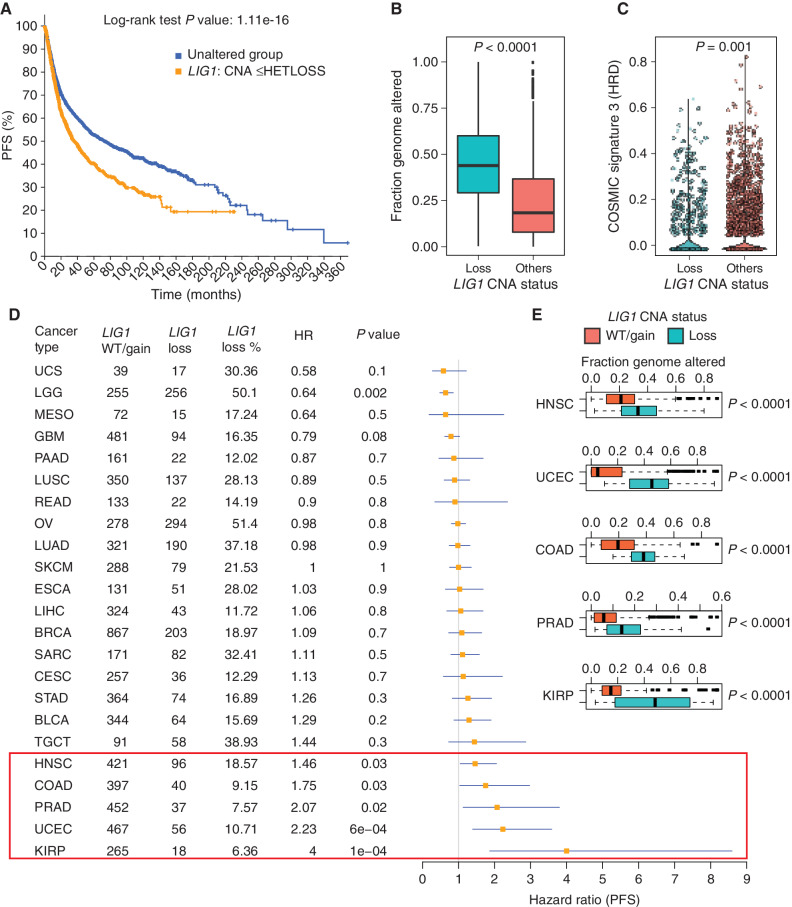
Figure 7. Pan-cancer analysis of LIG1 loss. A, Kaplan–Meier curve showing significantly reduced (log-rank P value) PFS for tumors with single-copy loss of LIG1 (HETLOSS, GISTIC ≤−1, indicated in orange) in the TCGA pan-cancer cohort. B, Box plot showing higher fraction genome altered (FGA) in tumors with LIG1 copy-number-loss tumors (shown in teal) relative to tumors that were LIG1 wild-type or displayed LIG1 gain (shown in orange). C, Violin plot showing significantly lower (Wilcoxon rank sum test) COSMIC signature 3 scores in LIG1-loss tumors (shown in teal). D, Forest plot showing the impact of LIG1 copy-number loss on PFS by cancer type along with LIG1 wild-type (WT)/gain/loss frequency, HR, and corresponding P value. BLCA, bladder urothelial carcinoma; BRCA, breast invasive carcinoma; CESC, cervical squamous cell carcinoma and endocervical adenocarcinoma; COAD, colon adenocarcinoma; ESCA, esophageal carcinoma; GBM, glioblastoma multiforme; HNSC, head and neck squamous cell carcinoma; KIRP, kidney renal papillary cell carcinoma; LGG, brain lower grade glioma; LIHC, liver hepatocellular carcinoma; LUAD, lung adenocarcinoma; LUSC, lung squamous cell carcinoma; MESO, mesothelioma; OV, ovarian serous cystadenocarcinoma; PAAD, pancreatic adenocarcinoma; PRAD, prostate adenocarcinoma; SARC, sarcoma; SKCM, skin cutaneous melanoma; STAD, stomach adenocarcinoma; TGCT, testicular germ cell tumors; UCEC, uterine corpus endometrial carcinoma; UCS, uterine carcinosarcoma. E, Box plot showing significantly higher (by Wilcoxon rank sum test) FGA (representing chromosomal instability) in tumors that had LIG1 copy-number loss versus tumors with either wild-type LIG1 or LIG1 copy-number gain. Shown are the only five cancers (HNSC, UCEC, COAD, PRAD, and KIRP) that displayed a significant association between LIG1 loss and adverse prognosis.

Pan-cancer analysis of LIG1 loss. A, Kaplan–Meier curve showing significantly reduced (log-rank P value) PFS for tumors with single-copy loss of LIG1 (HETLOSS, GISTIC ≤−1, indicated in orange) in the TCGA pan-cancer cohort. B, Box plot showing higher fraction genome altered (FGA) in tumors with LIG1 copy-number-loss tumors (shown in teal) relative to tumors that were LIG1 wild-type or displayed LIG1 gain (shown in orange). C, Violin plot showing significantly lower (Wilcoxon rank sum test) COSMIC signature 3 scores in LIG1-loss tumors (shown in teal). D, Forest plot showing the impact of LIG1 copy-number loss on PFS by cancer type along with LIG1 wild-type (WT)/gain/loss frequency, HR, and corresponding P value. BLCA, bladder urothelial carcinoma; BRCA, breast invasive carcinoma; CESC, cervical squamous cell carcinoma and endocervical adenocarcinoma; COAD, colon adenocarcinoma; ESCA, esophageal carcinoma; GBM, glioblastoma multiforme; HNSC, head and neck squamous cell carcinoma; KIRP, kidney renal papillary cell carcinoma; LGG, brain lower grade glioma; LIHC, liver hepatocellular carcinoma; LUAD, lung adenocarcinoma; LUSC, lung squamous cell carcinoma; MESO, mesothelioma; OV, ovarian serous cystadenocarcinoma; PAAD, pancreatic adenocarcinoma; PRAD, prostate adenocarcinoma; SARC, sarcoma; SKCM, skin cutaneous melanoma; STAD, stomach adenocarcinoma; TGCT, testicular germ cell tumors; UCEC, uterine corpus endometrial carcinoma; UCS, uterine carcinosarcoma. E, Box plot showing significantly higher (by Wilcoxon rank sum test) FGA (representing chromosomal instability) in tumors that had LIG1 copy-number loss versus tumors with either wild-type LIG1 or LIG1 copy-number gain. Shown are the only five cancers (HNSC, UCEC, COAD, PRAD, and KIRP) that displayed a significant association between LIG1 loss and adverse prognosis.