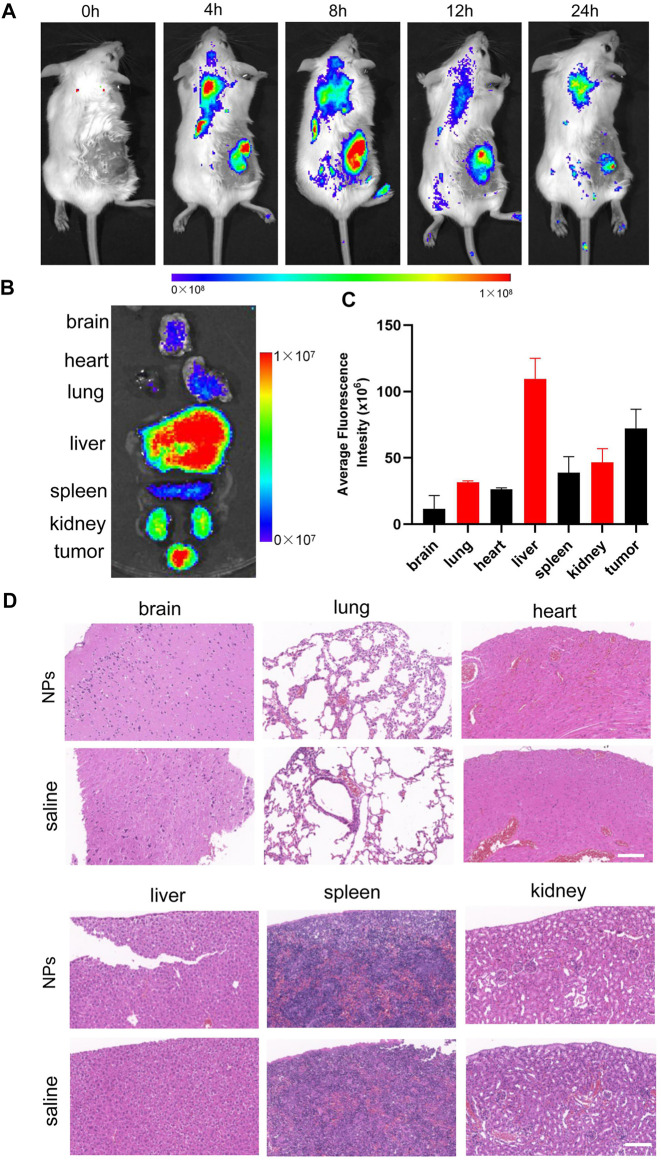
FIGURE 6.
(A) Biodistribution of IR780/PLGA@MnO2 NPs in tumor-bearing mice at different time points by in vivo fluorescent imaging. (B,C) Fluorescence imaging of major organs and tumor at 8 h after injection of the IR780/PLGA@MnO2 NPs. (D) H&E-staining images of major organs collected from the IR780/PLGA@MnO2 NPs and saline groups.

