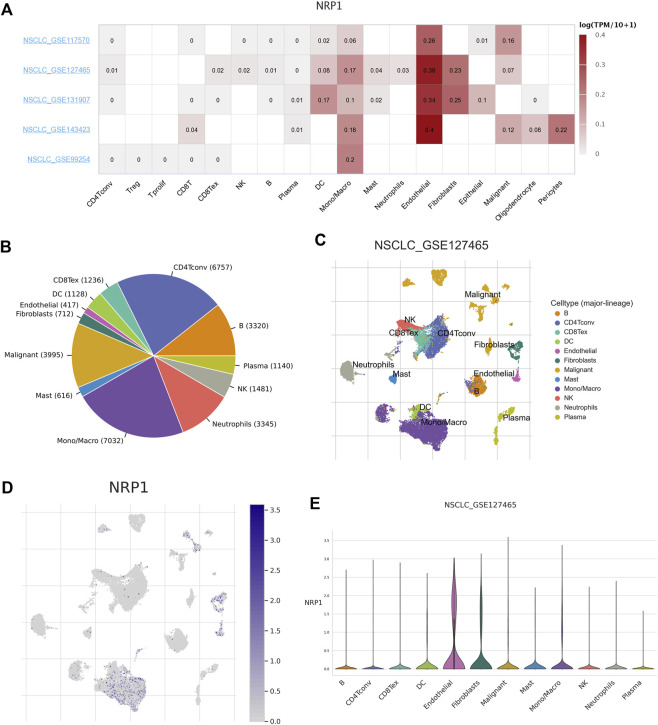
FIGURE 3.
Correlation between NRP1 expression and TME in NSCLC (A) The heatmap showing the correlation between NRP1 expression level and TME in NSCLC tissues. (B) Pie chart showing the number of each cell type in the NSCLC_GSE127465 dataset (C) The distribution of each cell type in the NSCLC_GSE127465 dataset. (D) Heatmap showing the expression distribution of NRP1 across different cell types in the NSCLC_GSE127465 dataset. (E) The violin plot showing NRP1 expression of different cell types in the NSCLC_GSE127465 dataset.

