. 2022 Sep 2;3(6):536–553. doi: 10.1158/2643-3230.BCD-21-0217

Figure 4.

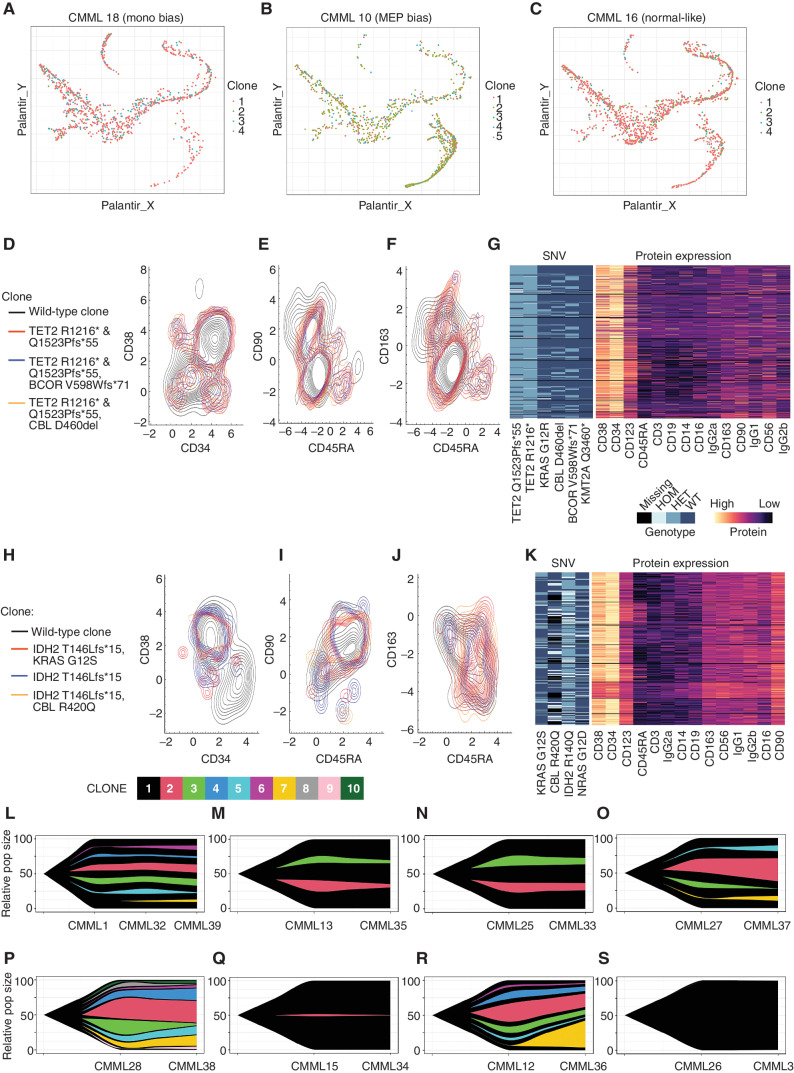
Figure 4. The monocytic-bias CMML phenotype is not driven by a clonally distinct population. Cells from monocytic-biased (A), MEP-biased (B), and normal-like (C) CMML samples plotted in a pseudotime map show differentiation trajectories. Cells are colored by their mitoClone assigned clone and do not show any association between trajectory and clone. D–G, A MEP-bias and low CD120b+ patient from the flow cytometry cohort (4-I-001) and (H–K) a monocytic-bias and high CD120b+ patient from the flow cytometry cohort (5-M-001) were selected for clonal characterization using single-cell DNA sequencing coupled with protein expression for hematologic markers with the Mission Bio Tapestri Platform. Contour plots of the distribution of distinct genotypic clones were visualized with their corresponding protein expression data. D and H, CD34 vs. CD38 (E, I), CD45RA vs. CD90, and (F, J) CD45RA vs. CD163 highlight the normal vs. malignant GMP population, where CD163 serves as a marker of monocytic-biased cells. G and K, Multiassay heatmaps highlight the variants of interest used to define clones and their corresponding protein expression at single-cell resolution. In a complementary analysis in the scRNA-seq cohort, clonal populations derived from mitochondrial RNA mutations from the scRNA-seq were also performed on sequential samples using mitoClone. Across time points, samples show very similar clonal distributions regardless of treatment with (L–O) HMA, (P–Q) ruxolitinib, (R) chemotherapy, and (S) no treatment.

The monocytic-bias CMML phenotype is not driven by a clonally distinct population. Cells from monocytic-biased (A), MEP-biased (B), and normal-like (C) CMML samples plotted in a pseudotime map show differentiation trajectories. Cells are colored by their mitoClone assigned clone and do not show any association between trajectory and clone. D–G, A MEP-bias and low CD120b+ patient from the flow cytometry cohort (4-I-001) and (HK) a monocytic-bias and high CD120b+ patient from the flow cytometry cohort (5-M-001) were selected for clonal characterization using single-cell DNA sequencing coupled with protein expression for hematologic markers with the Mission Bio Tapestri Platform. Contour plots of the distribution of distinct genotypic clones were visualized with their corresponding protein expression data. D and H, CD34 vs. CD38 (E, I), CD45RA vs. CD90, and (F, J) CD45RA vs. CD163 highlight the normal vs. malignant GMP population, where CD163 serves as a marker of monocytic-biased cells. G and K, Multiassay heatmaps highlight the variants of interest used to define clones and their corresponding protein expression at single-cell resolution. In a complementary analysis in the scRNA-seq cohort, clonal populations derived from mitochondrial RNA mutations from the scRNA-seq were also performed on sequential samples using mitoClone. Across time points, samples show very similar clonal distributions regardless of treatment with (L–O) HMA, (P–Q) ruxolitinib, (R) chemotherapy, and (S) no treatment.