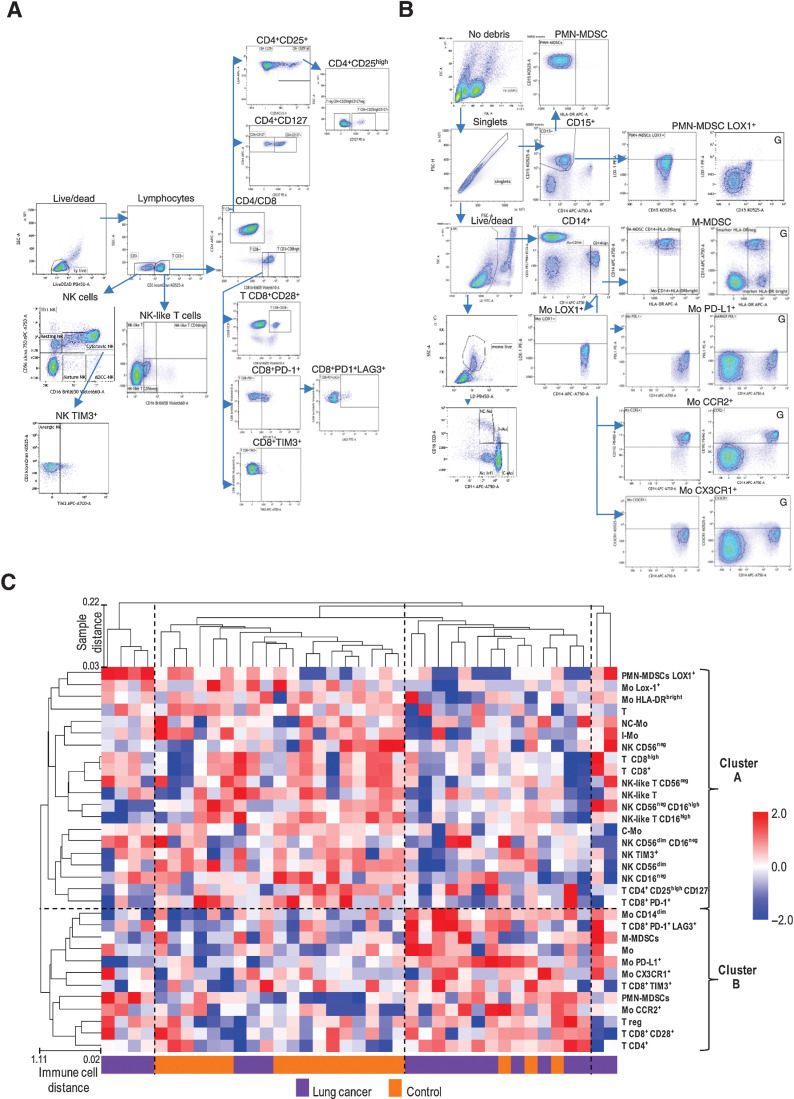
Figure 2.
The comprehensive peripheral immune cell profile of patients with screening-detected lung cancer and controls. Gating strategies of lymphoid populations (A) and myeloid populations (B). Plots marked with “G” are shown to indicate the setting of the gate. C, Unsupervised clustering considering all 32 subpopulation analyzed in the training set. Dashed lines separate the 4 and the 2 clusters of samples and immune cells at the larger distance (1-correlation), respectively.

