Figure 1.
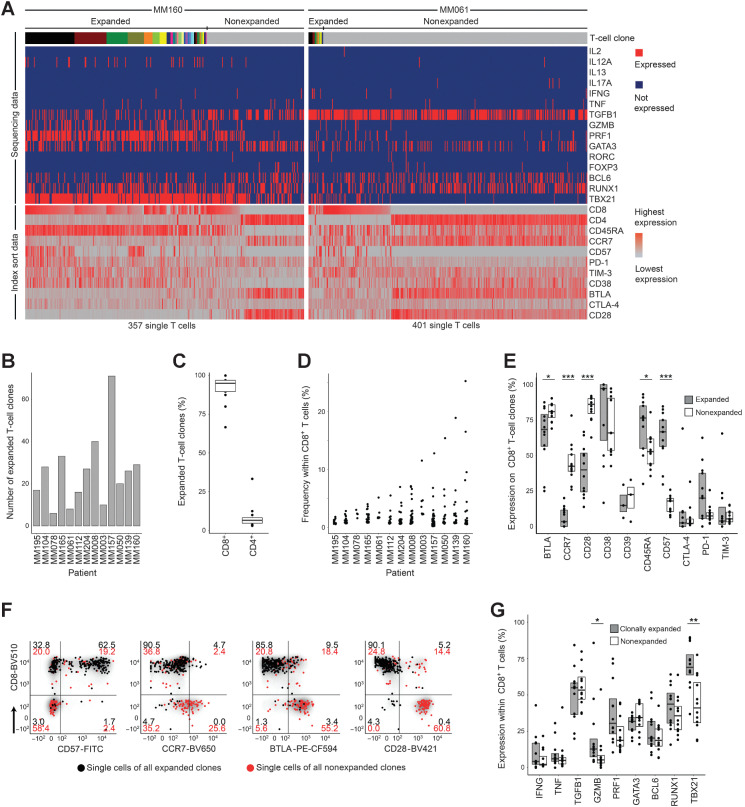
Clonal expansion–associated phenotypes of bone marrow T cells. A, Parallel determination of TCRαβ sequences, transcription factors, and cytokine gene expression from amplified cDNA of single FACS-sorted T cells. Single cells are arranged in columns with each column representing one cell. The top bar indicates TCR sequences; adjacent cells with the same color in the top bar indicate identical TCRαβ CDR3 amino acid sequences. Clonal expansion was defined as the detection of at least two cells with identical TCRαβ CDR3 sequences. The upper part of the heat map indicates single-cell gene expression determined by targeted panel sequencing. The lower part of the heat map visualizes corresponding FACS index sort data. The heat maps show data from patients MM160 and MM061 as examples for strong and weak clonal T-cell expansion, respectively. B, Absolute numbers of expanded bone marrow T-cell clones per patient (n = 13). Patients were ordered by size of the most expanded clone per patient as shown in D. C, Percentages of expanded T-cell clones expressing CD8 or CD4. Data points indicate individual patients. D, Frequencies of expanded CD8+ T-cell clones within CD8+ T cells. Each data point represents one unique T-cell clone. E, Immune phenotypes of CD8+ expanded and nonexpanded T-cell clones determined by FACS index sorting. Data from all 13 patients are summarized as box plots, and data points indicate individual patients. BTLA and CD28 were stained in n = 12; CD38, CTLA-4, and TIM-3 in 11; and CD39 in 3 (out of 13 patients). A clone was determined positive for the indicated parameter if the majority of cells belonging to this clone were positive. F, Gating example for patient MM160. Each data point represents one T-cell belonging to an expanded (black) or nonexpanded (red) clone. Numbers within gates indicate percentages. G, Single-cell gene expression of selected cytokines and transcription factors that were detected in more than 5% of expanded or nonexpanded CD8+ T cells. Data points represent individual patients. All panels show data from 13 patients, unless otherwise stated. Single-cell FACS and sequencing for each patient were done once resulting in 13 experiments. Box plots represent 25th to 75th percentiles; lines within boxes indicate medians. Statistical significance was calculated using the two-sided Wilcoxon test; *, P < 0.05; **, P < 0.005; ***, P < 0.0005.

