. 2022 Sep 12;10(11):1326–1339. doi: 10.1158/2326-6066.CIR-22-0407

Figure 1.

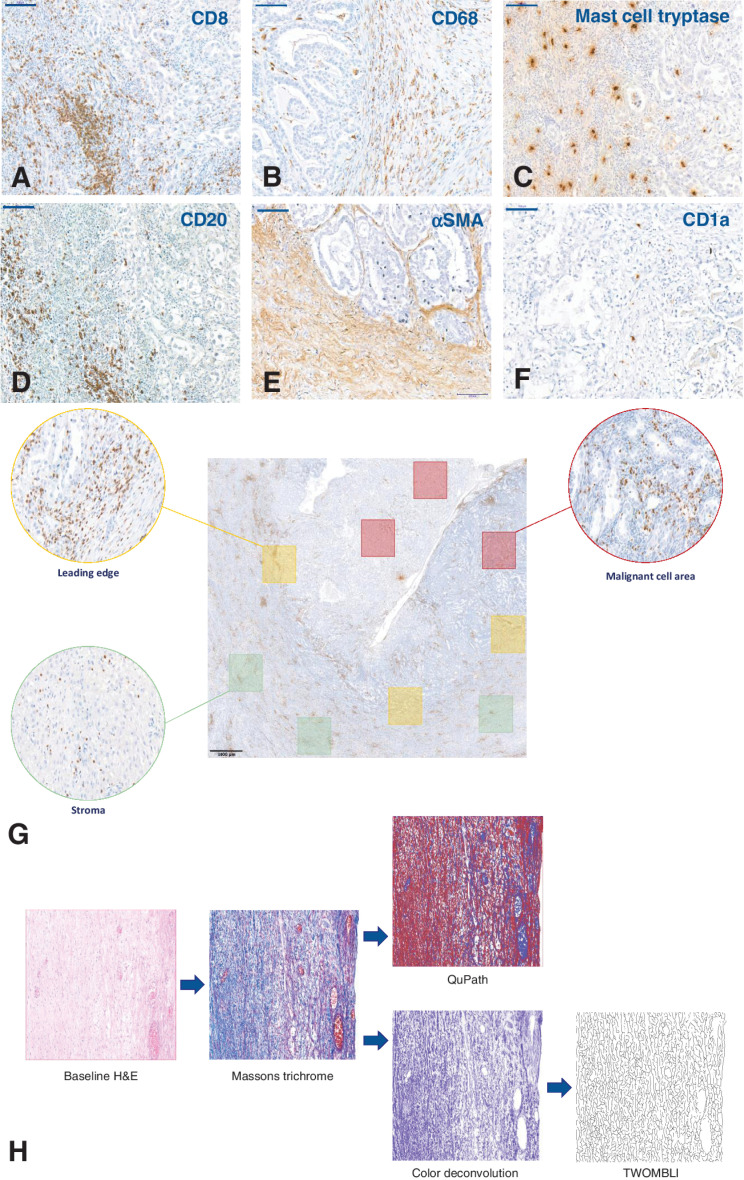
Figure 1. Examples of IHC identification of immune markers in CCOC and subsequent quantification methods. A–F, Representative IHC images used to identify immune cell populations in advanced CCOC. CD8 (A), CD68 (B), mast cell tryptase (C), CD20 (D), αSMA (E), CD1a (F). All images taken at 20× magnification; scale bar: 100 μm. G, Topographical quantification. For spatial analysis of the TME, quantification occurred within ROI. Red boxes: MCA, defined as a region that contained predominantly malignant cells; Green boxes: stromal area, defined as areas containing no malignant cells; Yellow boxes: the LE, defined as areas containing equal amounts of both malignant cells and stromal cells. Three 1×1 mm squares within each ROI were identified, with each slide having nine individually quantified areas. To remove any potential selection bias, each ROI was selected from the baseline H&E slide and translated onto consecutive slides. The immune cells shown in this example are CD8+ cells; scale bar: 1,000 μmol/L. H, Image processing pipeline for collagen analysis. Textural analysis of stained collagen was carried out using Haralick features on QuPath, and structure was analyzed using TWOMBLI. Representative images of Masson's trichrome within each ROI were either directly input into QuPath or underwent a deconvolution step on ImageJ before analysis by TWOMBLI.

Examples of IHC identification of immune markers in CCOC and subsequent quantification methods. A–F, Representative IHC images used to identify immune cell populations in advanced CCOC. CD8 (A), CD68 (B), mast cell tryptase (C), CD20 (D), αSMA (E), CD1a (F). All images taken at 20× magnification; scale bar: 100 μm. G, Topographical quantification. For spatial analysis of the TME, quantification occurred within ROI. Red boxes: MCA, defined as a region that contained predominantly malignant cells; Green boxes: stromal area, defined as areas containing no malignant cells; Yellow boxes: the LE, defined as areas containing equal amounts of both malignant cells and stromal cells. Three 1 × 1 mm squares within each ROI were identified, with each slide having nine individually quantified areas. To remove any potential selection bias, each ROI was selected from the baseline H&E slide and translated onto consecutive slides. The immune cells shown in this example are CD8+ cells; scale bar: 1,000 μm. H, Image processing pipeline for collagen analysis. Textural analysis of stained collagen was carried out using Haralick features on QuPath, and structure was analyzed using TWOMBLI. Representative images of Masson's trichrome within each ROI were either directly input into QuPath or underwent a deconvolution step on ImageJ before analysis by TWOMBLI.