. 2022 Sep 12;10(11):1326–1339. doi: 10.1158/2326-6066.CIR-22-0407

Figure 2.

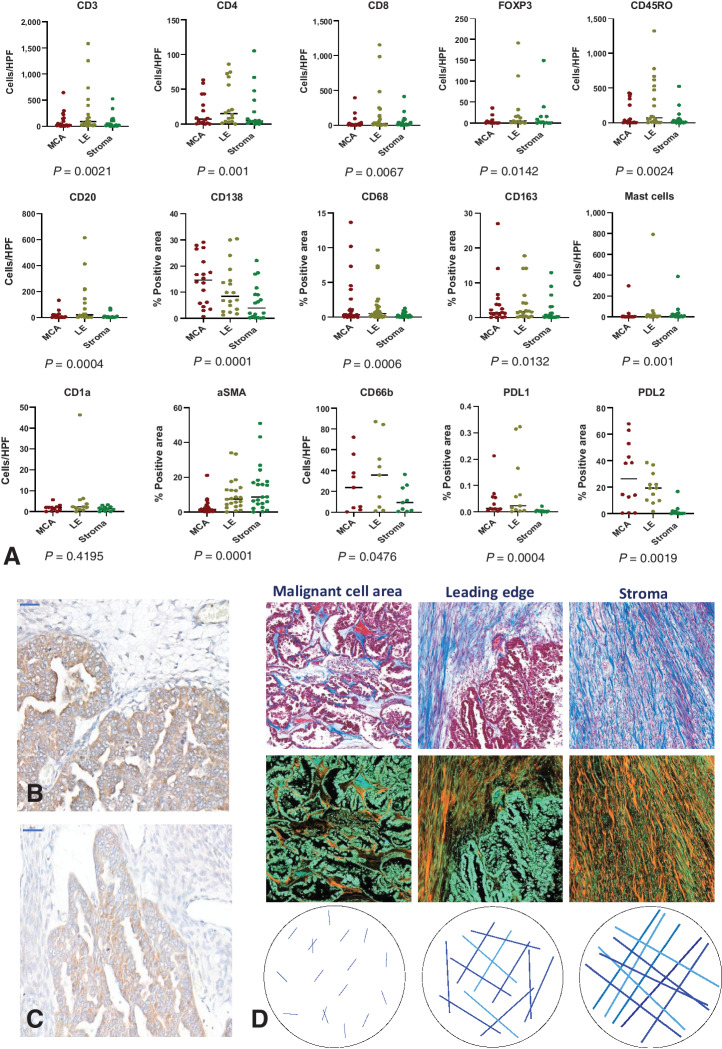
Figure 2. Variation in immune cell markers and the collagen matrix throughout the TME of advanced CCOC, with IHC identification of PDL2. A, Scatter plots showing median values for the indicated immune markers across the MCA, LE, and stroma of paired samples. Immune markers were assessed using IHC and quantified by either positive cells per high powered field (HPF) or percent positive area. The distribution of markers across the three ROI was analyzed in paired samples using a Friedman test with a post hoc Dunn multiple comparisons test; P values shown, error bars indicate medians. CD3, n = 21; CD8, n = 22; CD4, n = 16; FOXP3, n = 13; CD45RO, n = 20; CD20, n = 18; CD138, n = 18; CD68, n = 29, CD163, n = 18; mast cells, n = 18; CD1a, n = 12, αSMA, n = 34; CD66b, n = 9; PD-L1, n = 12; PD-L2, n = 12. B and C, PDL2 was evaluated using IHC on 12 samples and was confirmed using two different antibodies; scale bar: 50 μmol/L. D, Masson's trichrome was used to identify collagen (blue in the top row of images) across the MCA, LE, and stroma of 36 samples. Images were inverted to better visualize collagen content (orange in the bottom row).

Variation in immune cell markers and the collagen matrix throughout the TME of advanced CCOC, with IHC identification of PDL2. A, Scatter plots showing median values for the indicated immune markers across the MCA, LE, and stroma of paired samples. Immune markers were assessed using IHC and quantified by either positive cells per high powered field (HPF) or percent positive area. The distribution of markers across the three ROI was analyzed in paired samples using a Friedman test with a post hoc Dunn multiple comparisons test; P values shown, error bars indicate medians. CD3, n = 21; CD8, n = 22; CD4, n = 16; FOXP3, n = 13; CD45RO, n = 20; CD20, n = 18; CD138, n = 18; CD68, n = 29, CD163, n = 18; mast cells, n = 18; CD1a, n = 12, αSMA, n = 34; CD66b, n = 9; PD-L1, n = 12; PD-L2, n = 12. B and C, PDL2 was evaluated using IHC on 12 samples and was confirmed using two different antibodies; scale bar: 50 μm. D, Masson's trichrome was used to identify collagen (blue in the top row of images) across the MCA, LE, and stroma of 36 samples. Images were inverted to better visualize collagen content (orange in the bottom row).