. 2022 Sep 12;10(11):1326–1339. doi: 10.1158/2326-6066.CIR-22-0407

Figure 7.

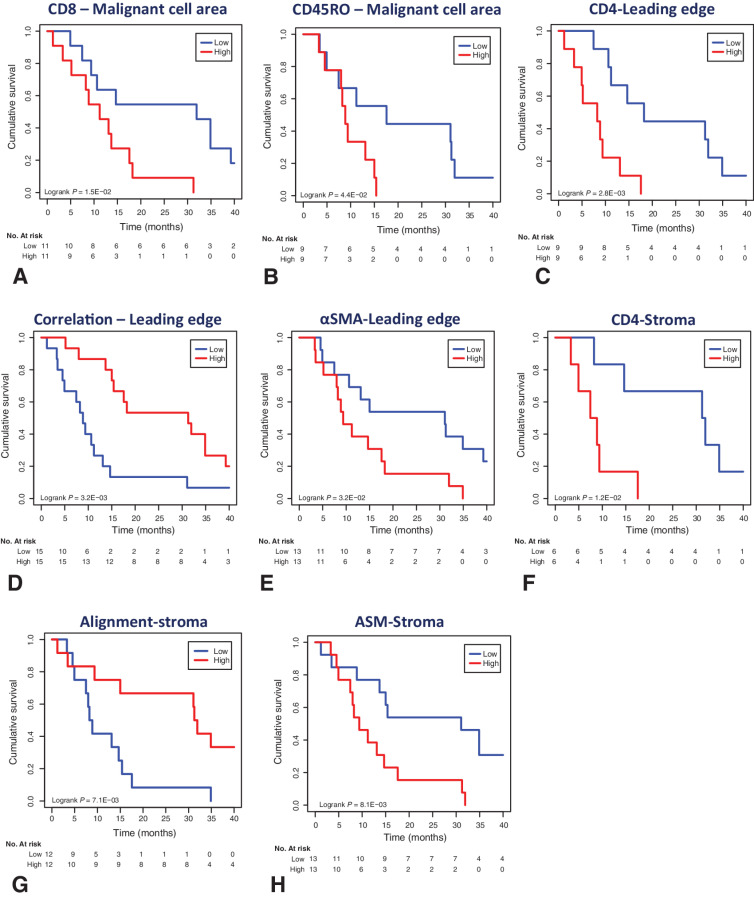
Figure 7. TME metrics which collate with OS in advanced CCOC. A–H, Kaplan–Meier curves of OS using the indicated eight TME metrics that were significant factors following univariate analysis (Supplementary Table S5). N = 38 patients from the FFPE cohort with clinical information and OS data were stratified into high and low groups for the indicated metrics using the median values as thresholds. Kaplan–Meier analysis was performed using the median values as thresholds. ASM, angular second moment.

TME metrics which collate with OS in advanced CCOC. AH, Kaplan–Meier curves of OS using the indicated eight TME metrics that were significant factors following univariate analysis (Supplementary Table S5). N = 38 patients from the FFPE cohort with clinical information and OS data were stratified into high and low groups for the indicated metrics using the median values as thresholds. Kaplan–Meier analysis was performed using the median values as thresholds. ASM, angular second moment.