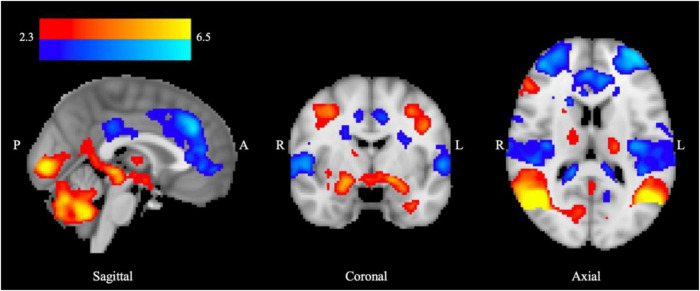
FIGURE 1.
BOLD response to aversive processing in all groups combined following placebo administration. Increased limbic BOLD signal across HD and DD groups for the aversive > neutral contrast is denoted in red, and decreased fronto-cortical BOLD signal indicated in blue. Color bar shows z-stat values representing average BOLD signal change across groups using FSL’s FLAME-1, mixed-effects analysis (n = 68, Z > 2.3, P < 0.05), controlling for center and age. MNI coordinates: x = 0.5 (sagittal), y = –4.7 (coronal), z = 13.7 (axial).

