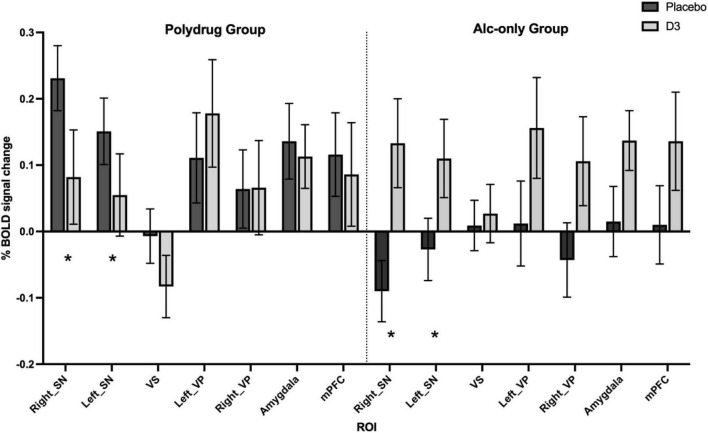
FIGURE 4.
Differential effect of D3 antagonism by ROI in AO vs. PD groups. A significant subgroup by drug by ROI interaction was observed in multivariate analysis [Pillai’s trace; F(6,26) = 2.659, p = 0.038], with post hoc analysis revealing significant effects in right and left substantia nigra (SN), see Supplementary Table 5. *Denotes the regions in which significant interactions occurred, primarily driven by a divergent effect of drug in AO compared with PD subgroups. Data are % BOLD signal change during the aversive > neutral contrast following administration of placebo and GSK598809 across PD (n = 17) and AO (n = 19) groups, controlling for age and center. Values are estimated marginal means (±SEM, with covariates appearing in the model evaluated at the following values: Centre1 = 0.11, Centre2 = 0.31, Age = 43.11).

