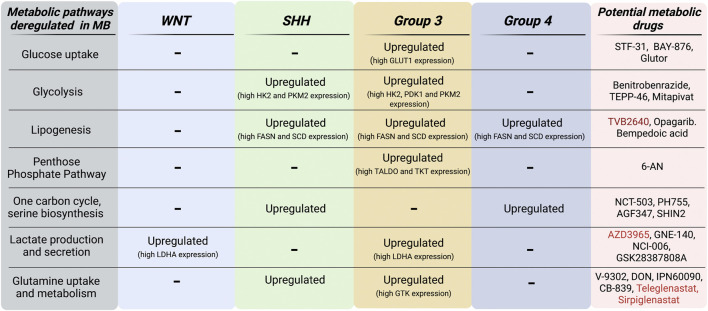
FIGURE 4.
MB subgroup-specific alterations of metabolic pathways. Schematic representation of both metabolic pathways and genes that are found upregulated in MB subgroups. Metabolic inhibitors currently in preclinical (black) and clinical (red) development for oncology applications are listed in this scheme. Figure is created in “BioRender.com”.

